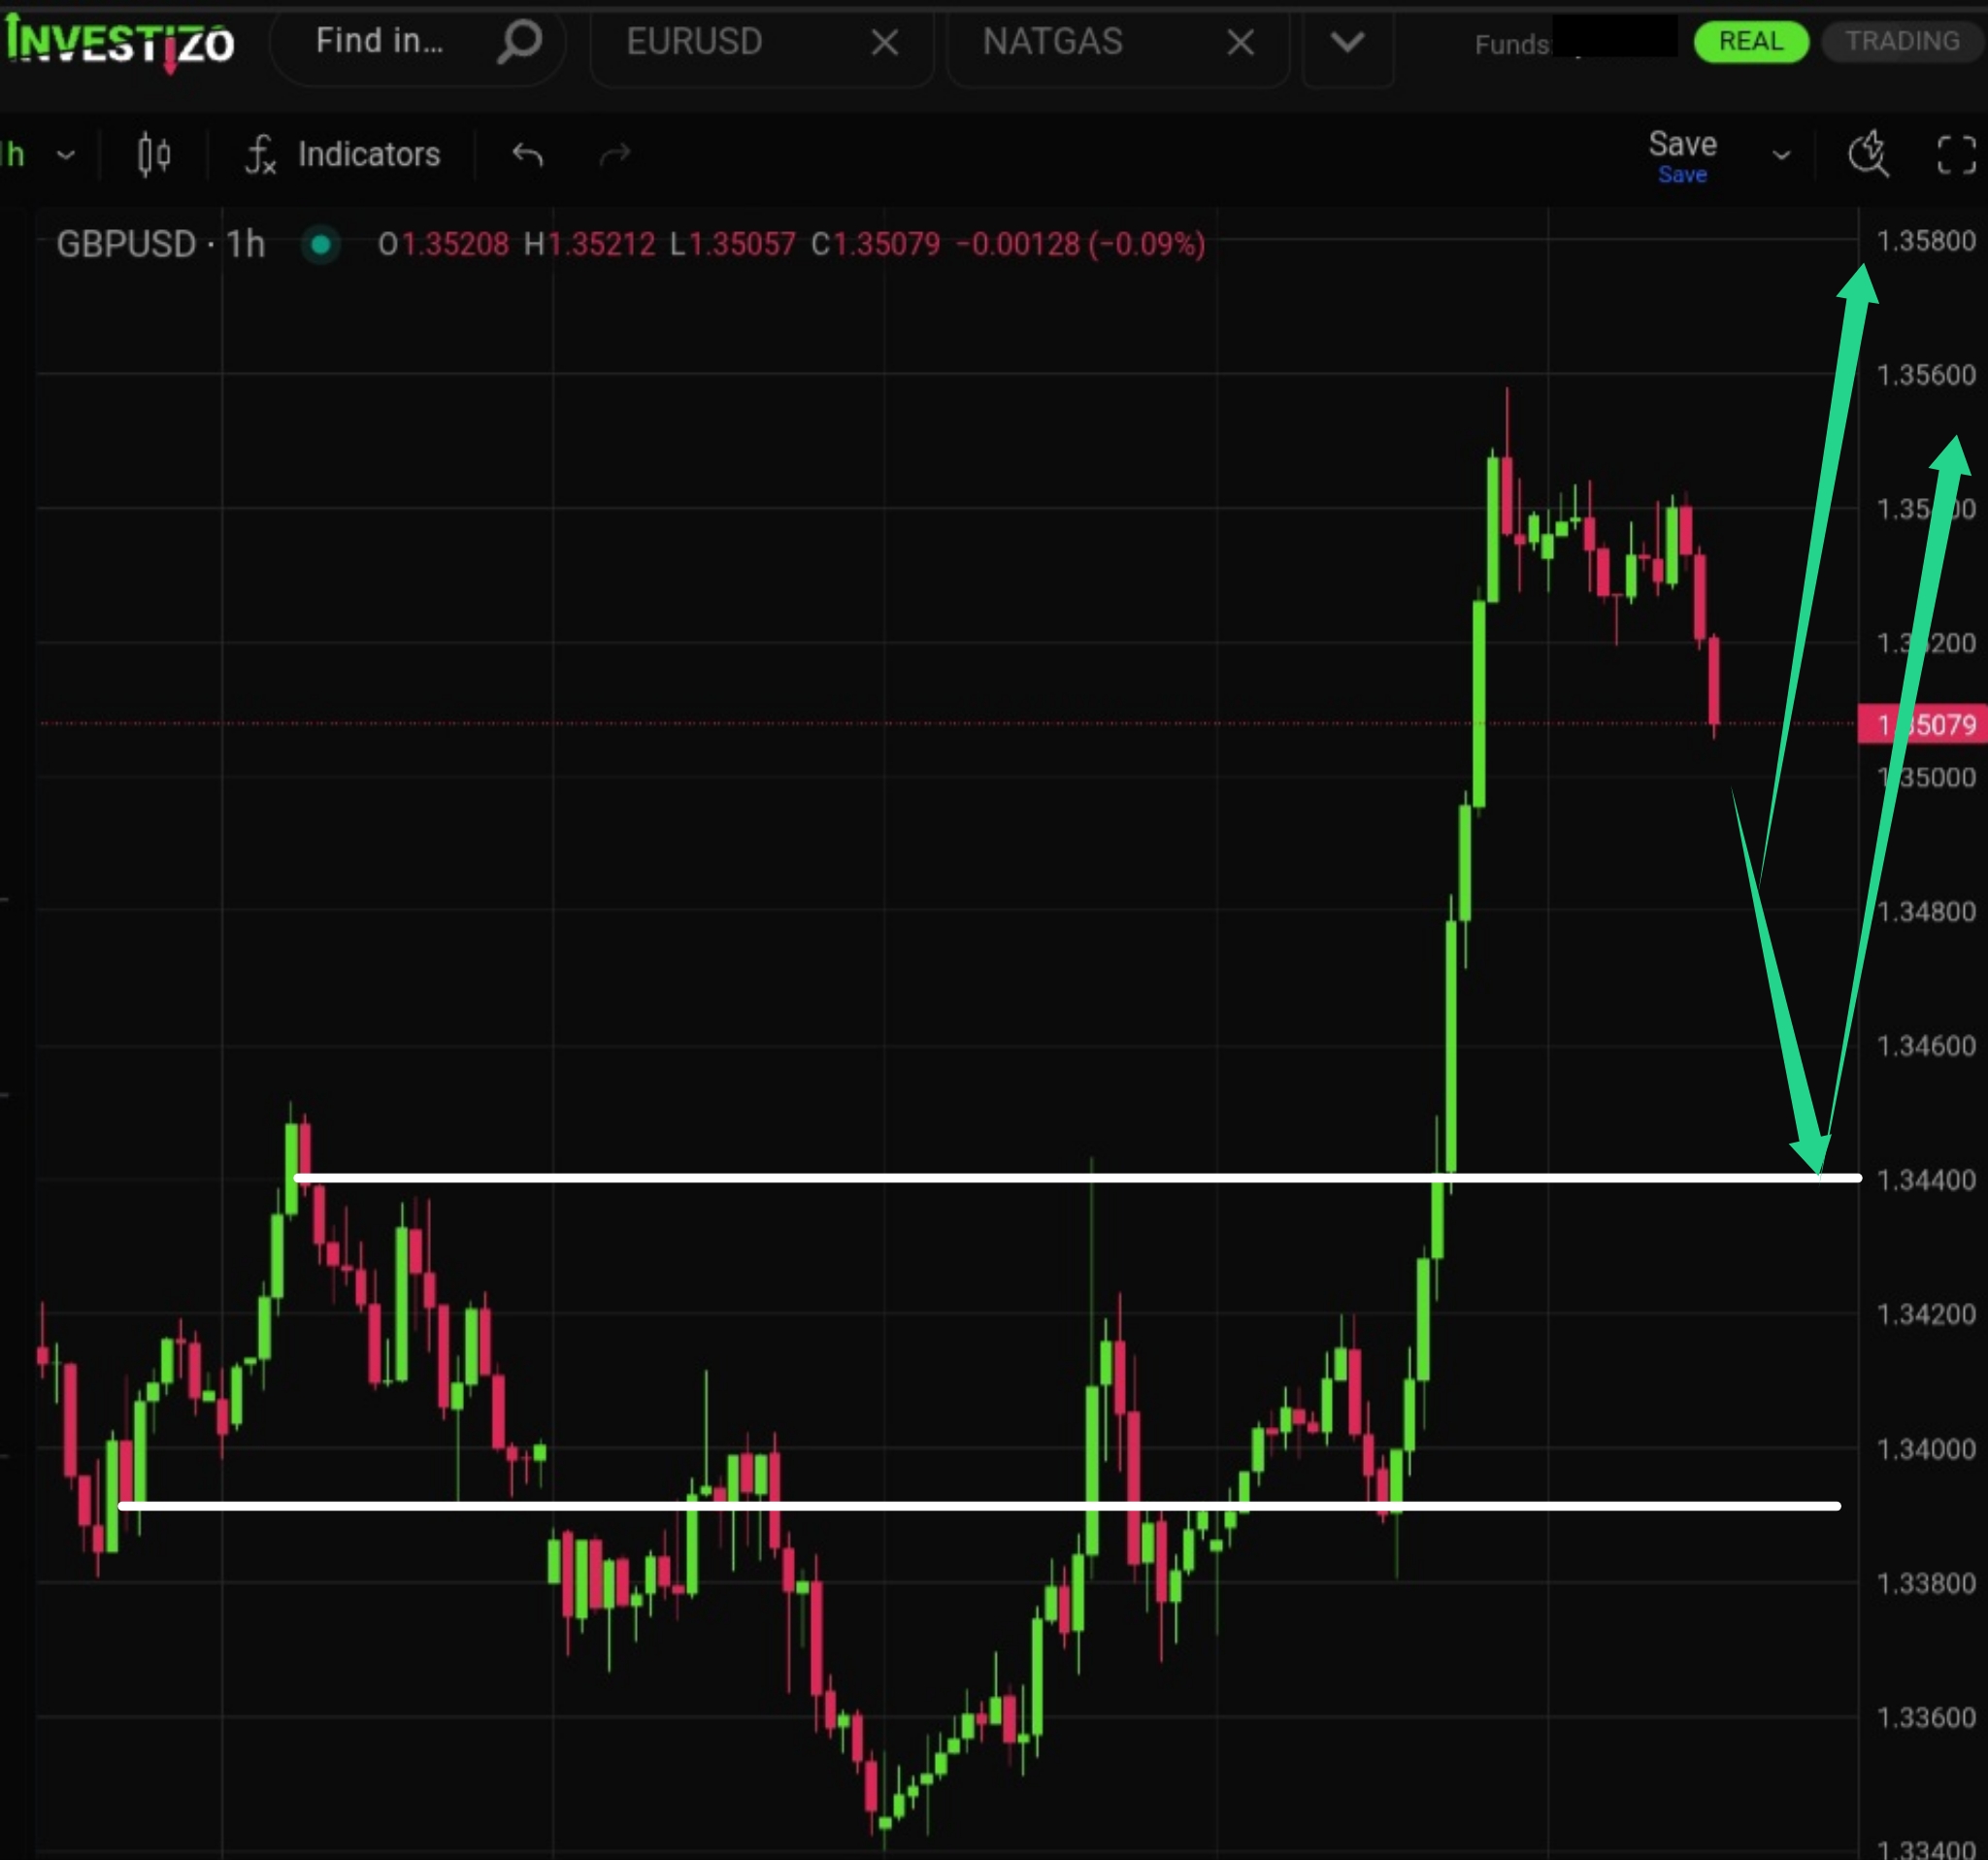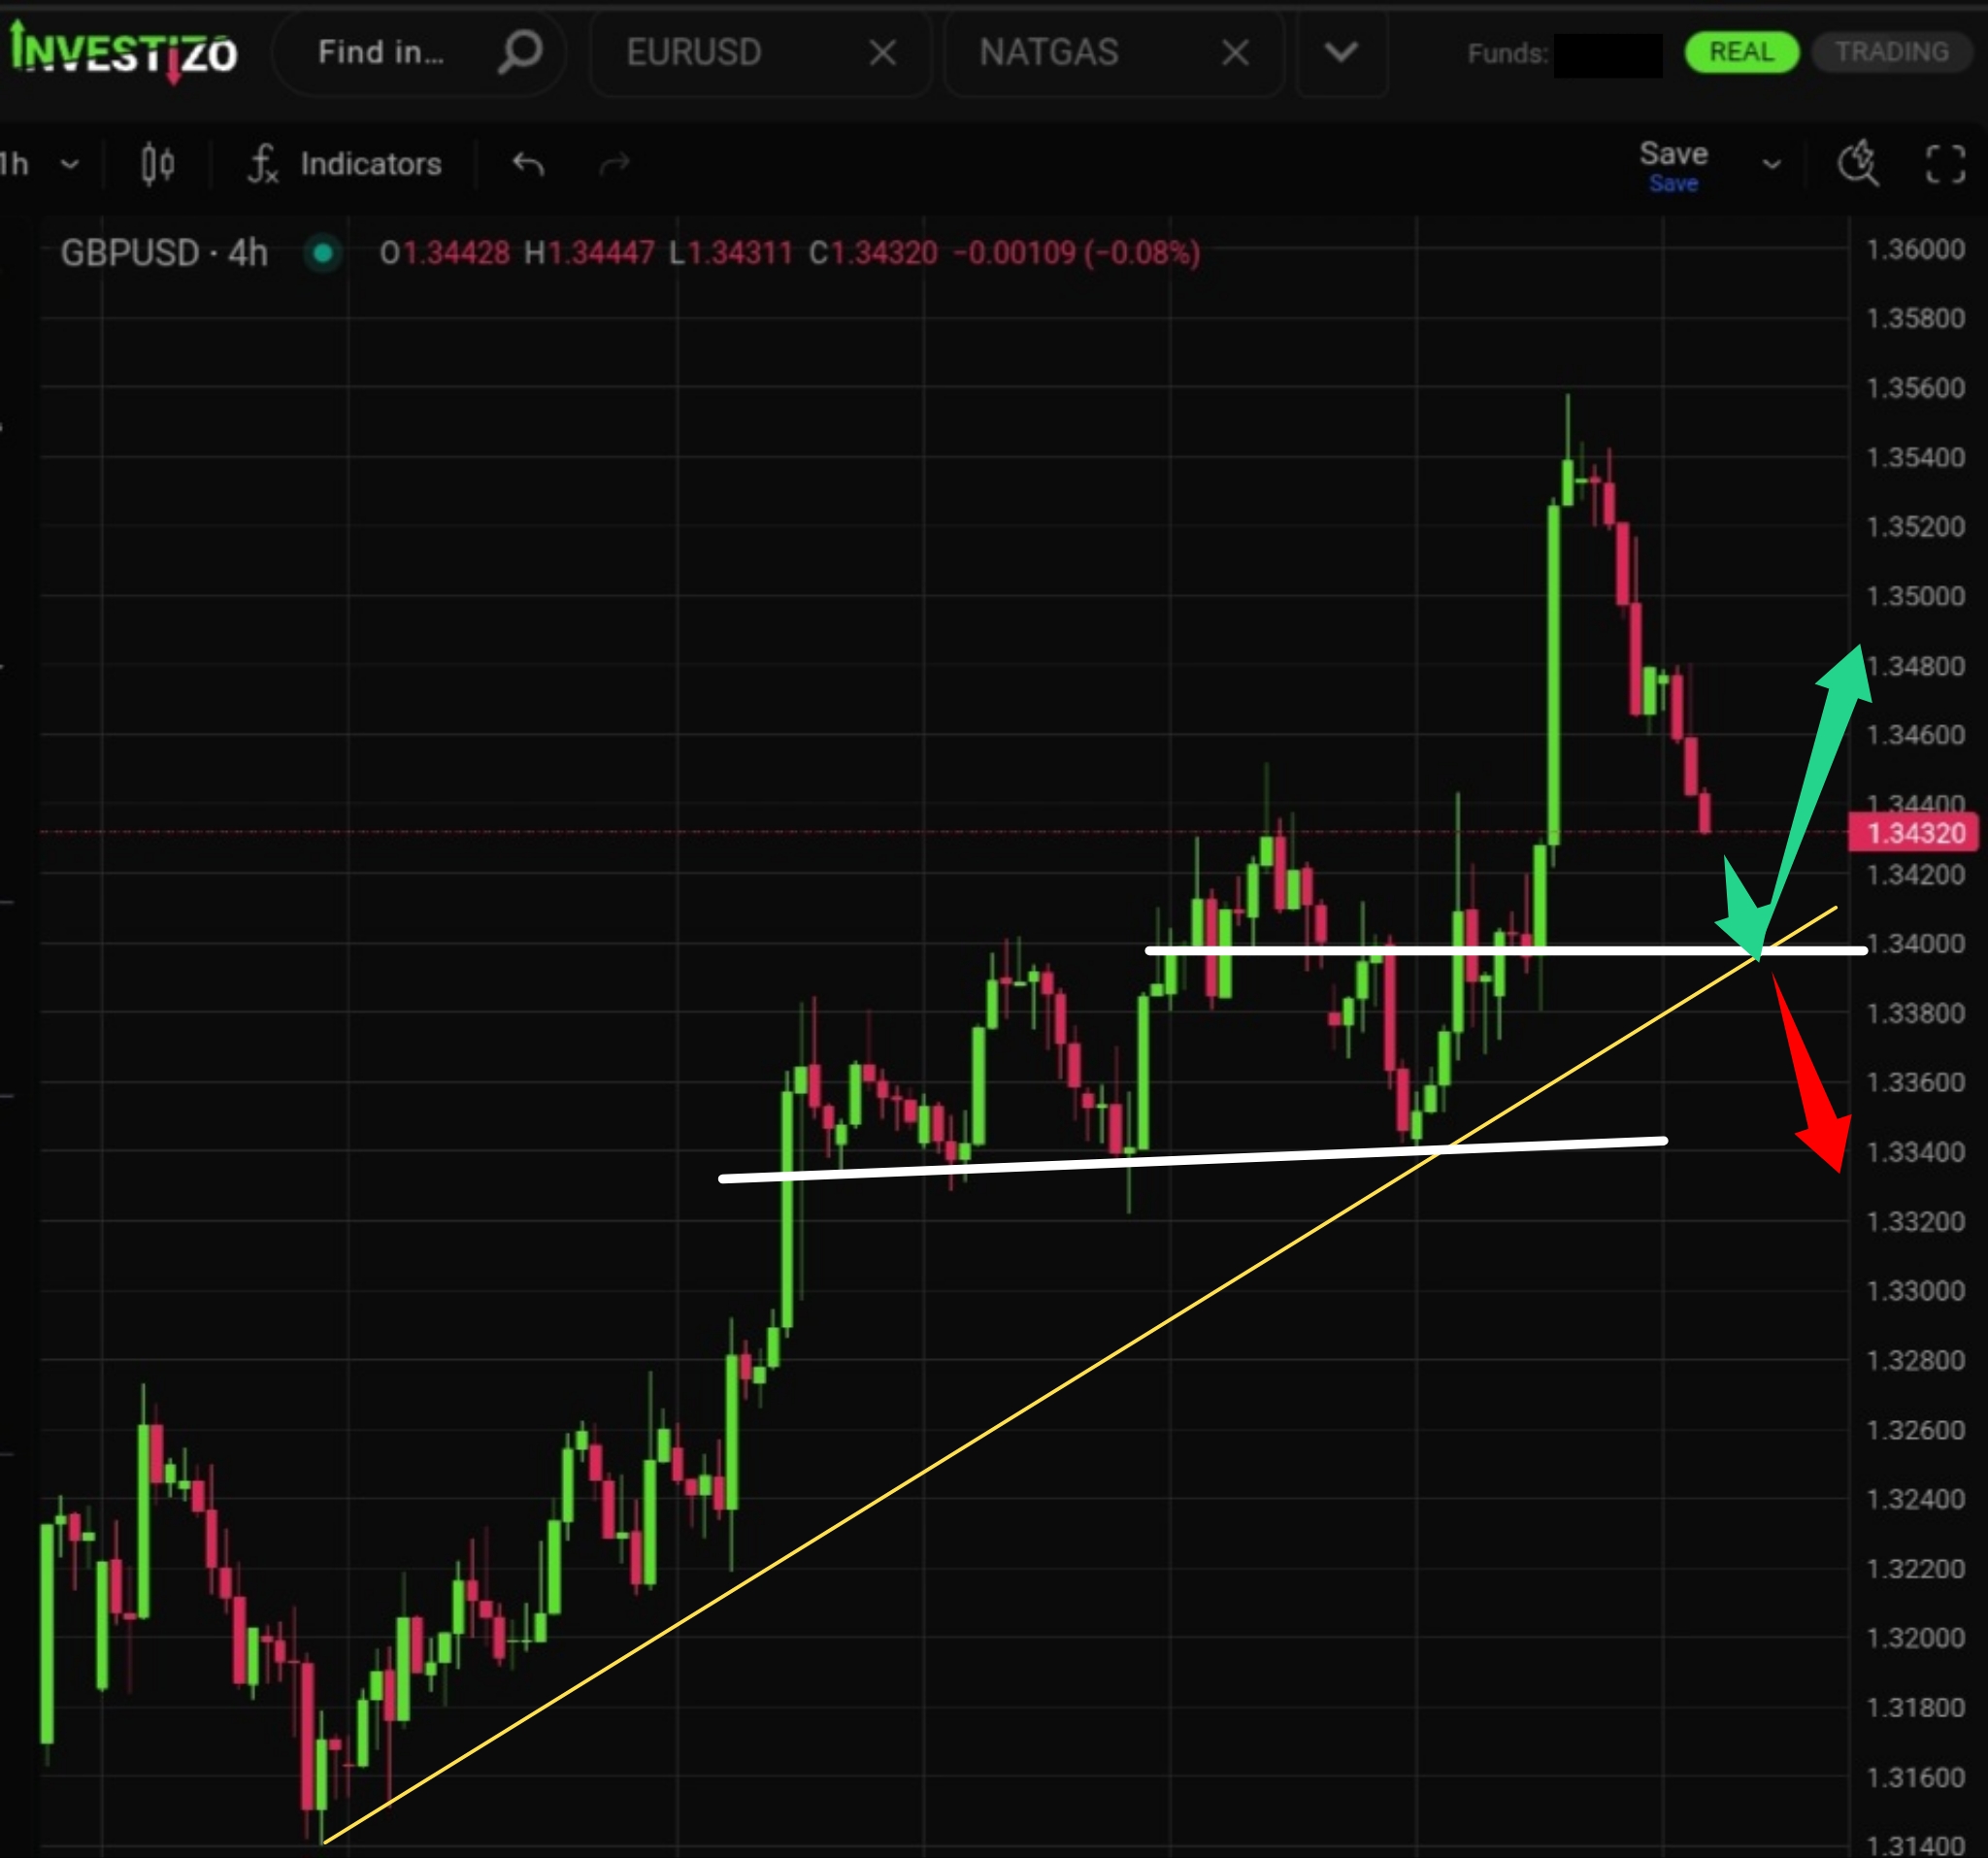
GBP/USD, Technical Analysis – H4
The downward correction is targeting the strong support level at 1.3400, which represents a significant confluence zone.
Investizo LTD. Business company number 25432 BC 2019
Suite 305, Griffith Corporate Centre,
P.O. Box 1510, Beachmont, Kingstown,
St. Vincent and the Grenadines
DUNS 817053497
Phone:+996312610515
E-mail: [email protected]
© 2019-2026 Investizo 18+ Todos los derechos reservados
Advertencia de riesgo: los CFD son productos financieros complejos que se negocian con margen. El comercio de CFD es arriesgado y puede no ser adecuado para todos los inversores. Asegúrese de comprender los riesgos involucrados, ya que puede perder todo su capital invertido.
The downward correction is targeting the strong support level at 1.3400, which represents a significant confluence zone.
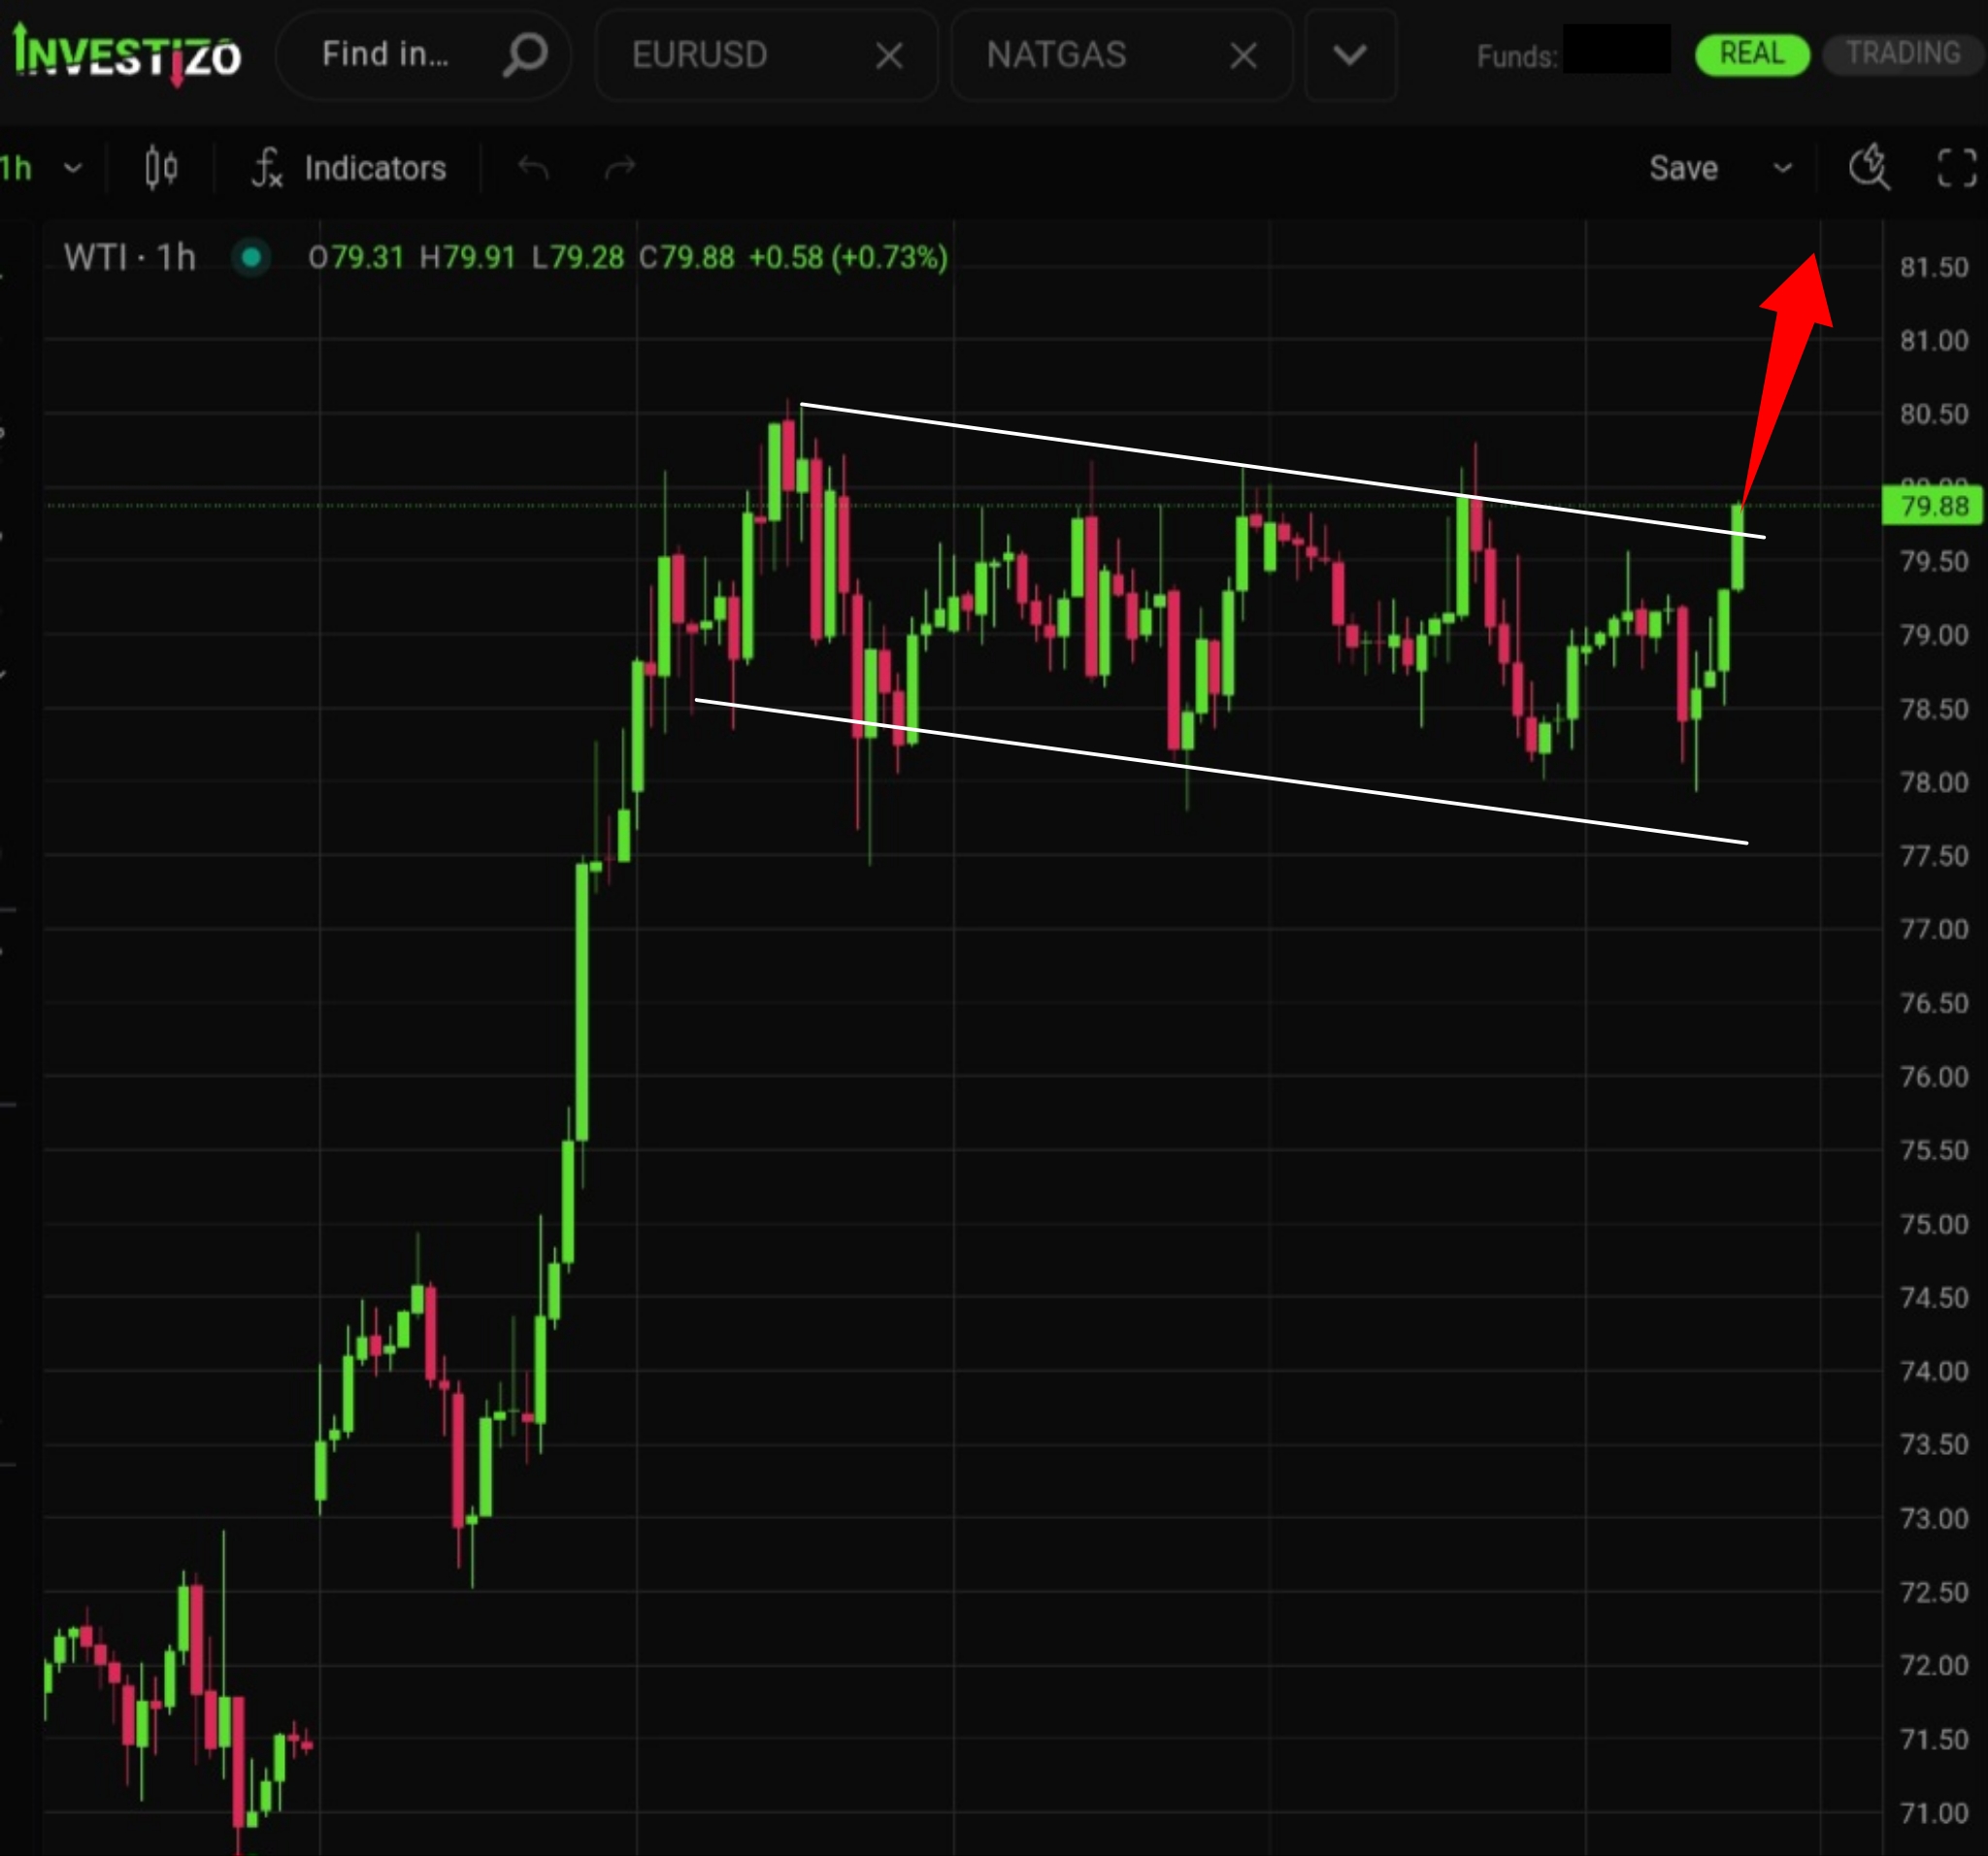
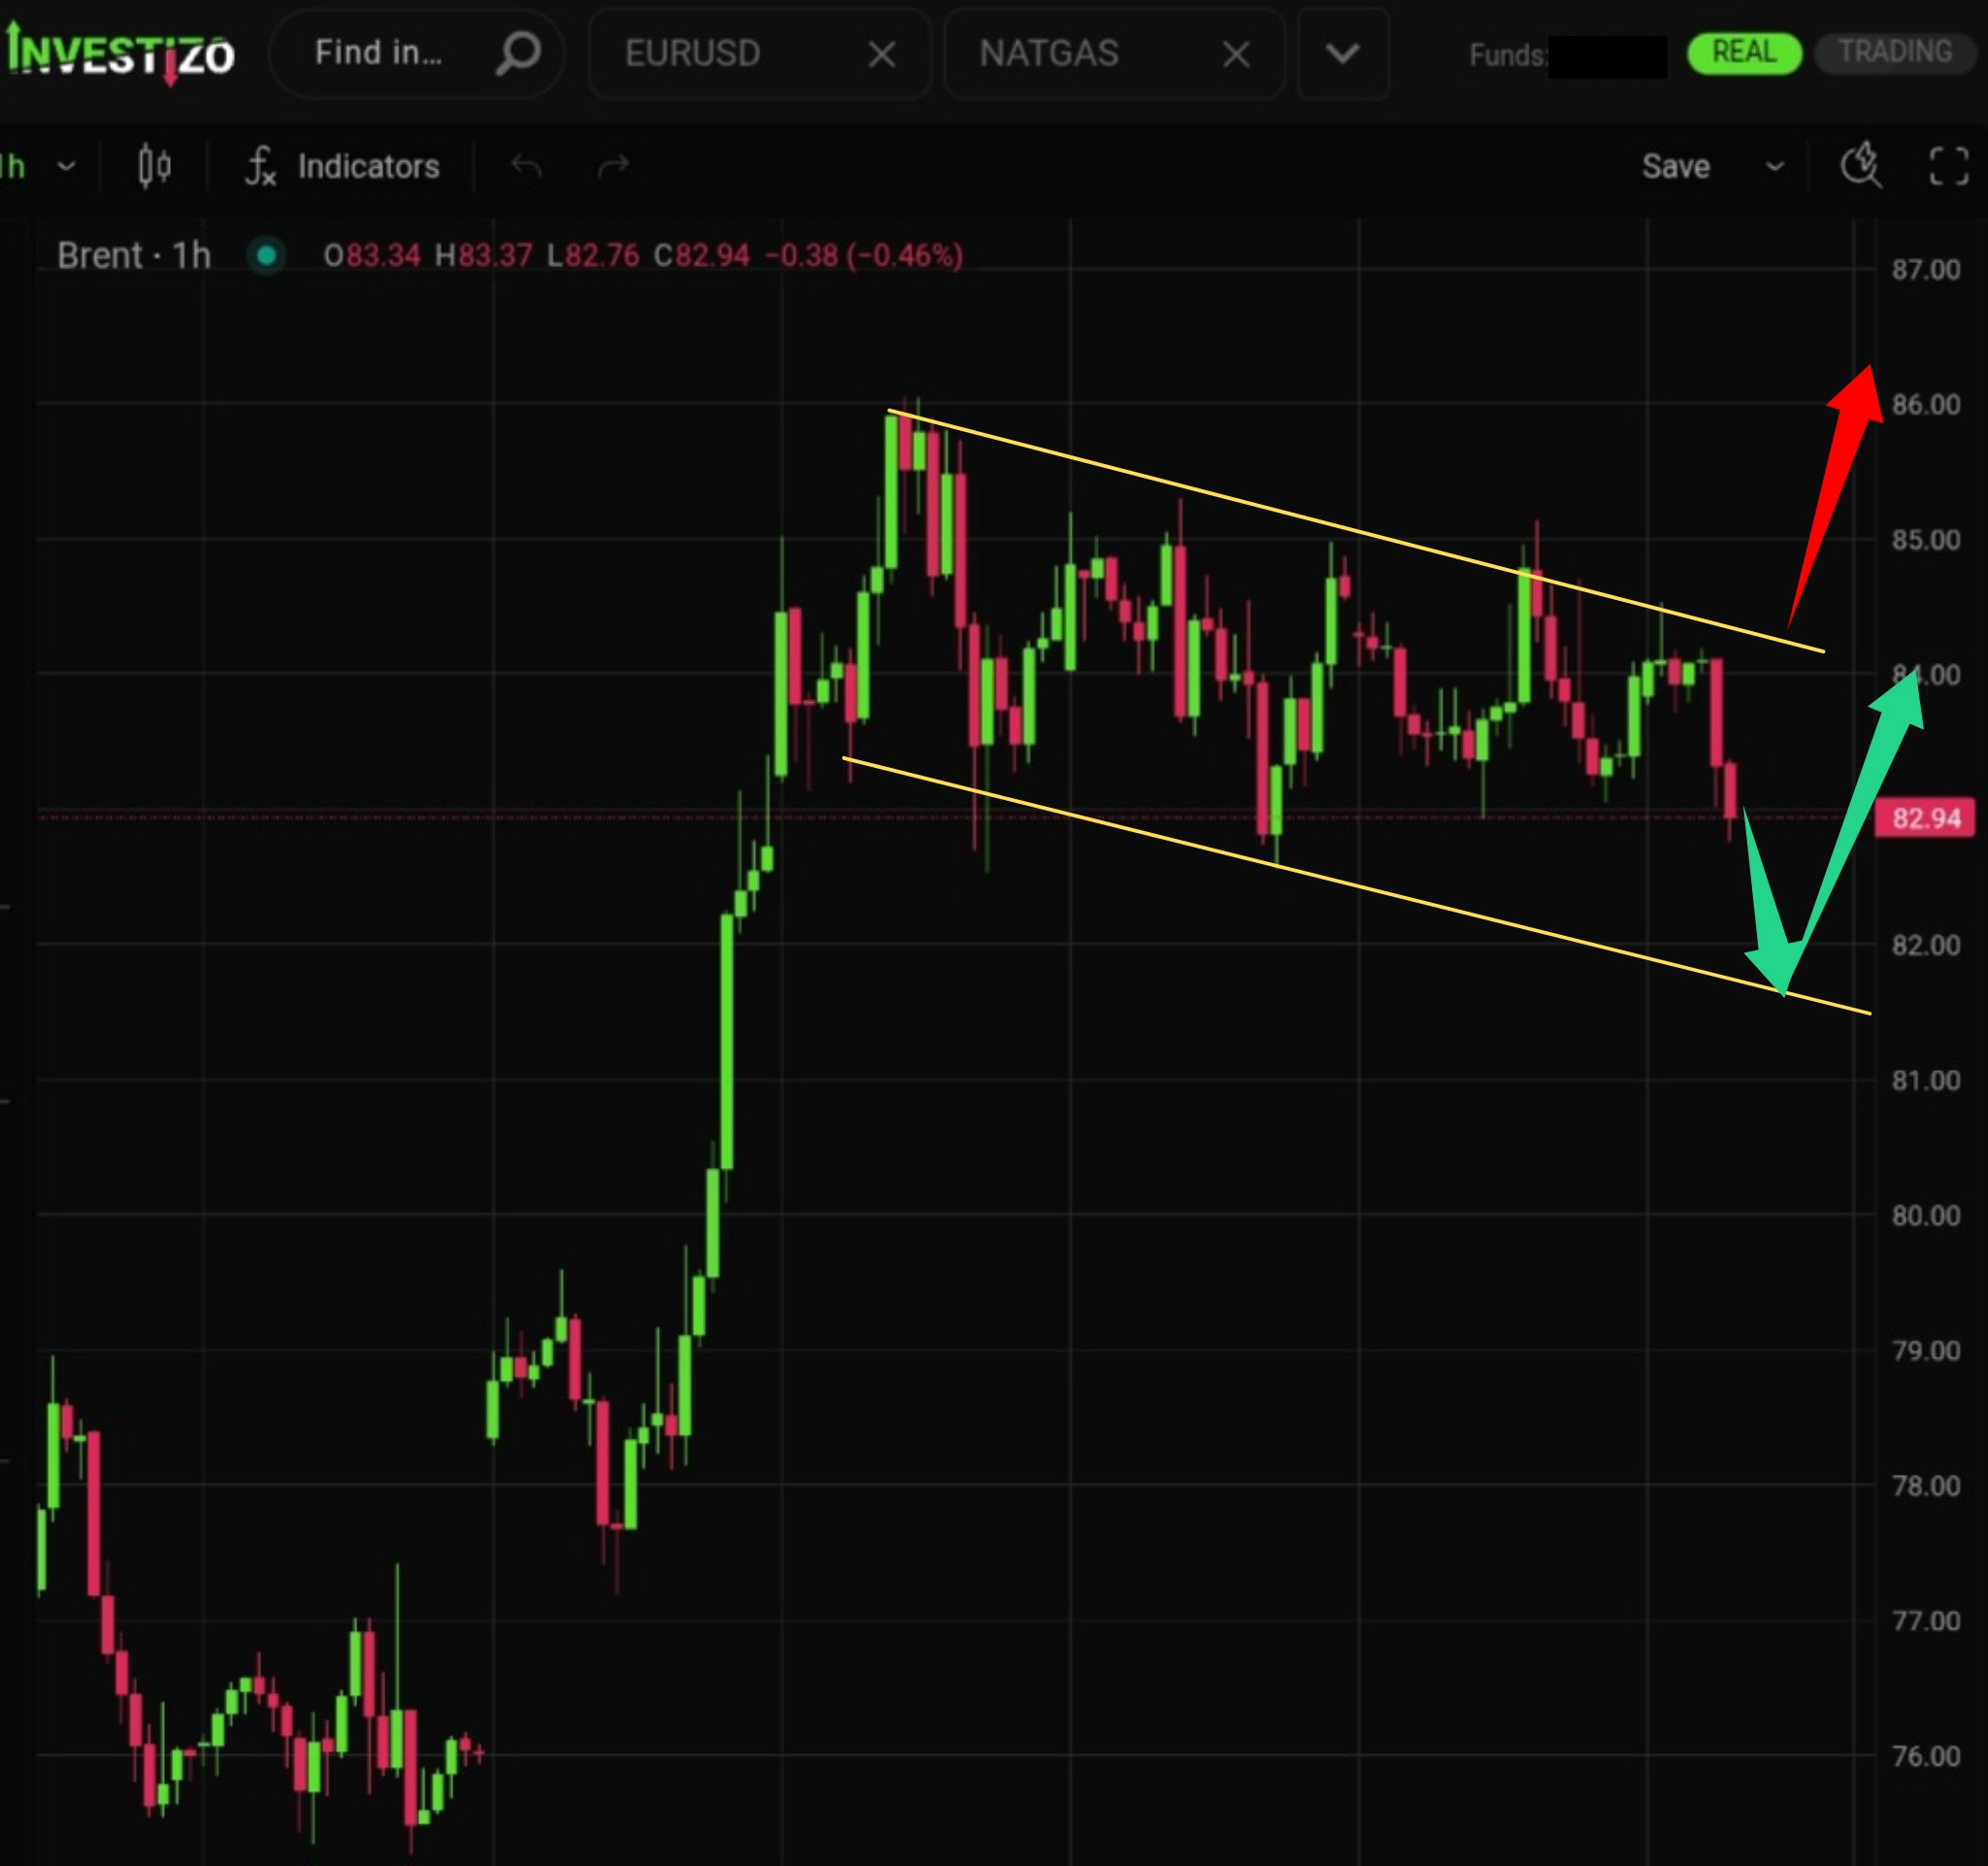
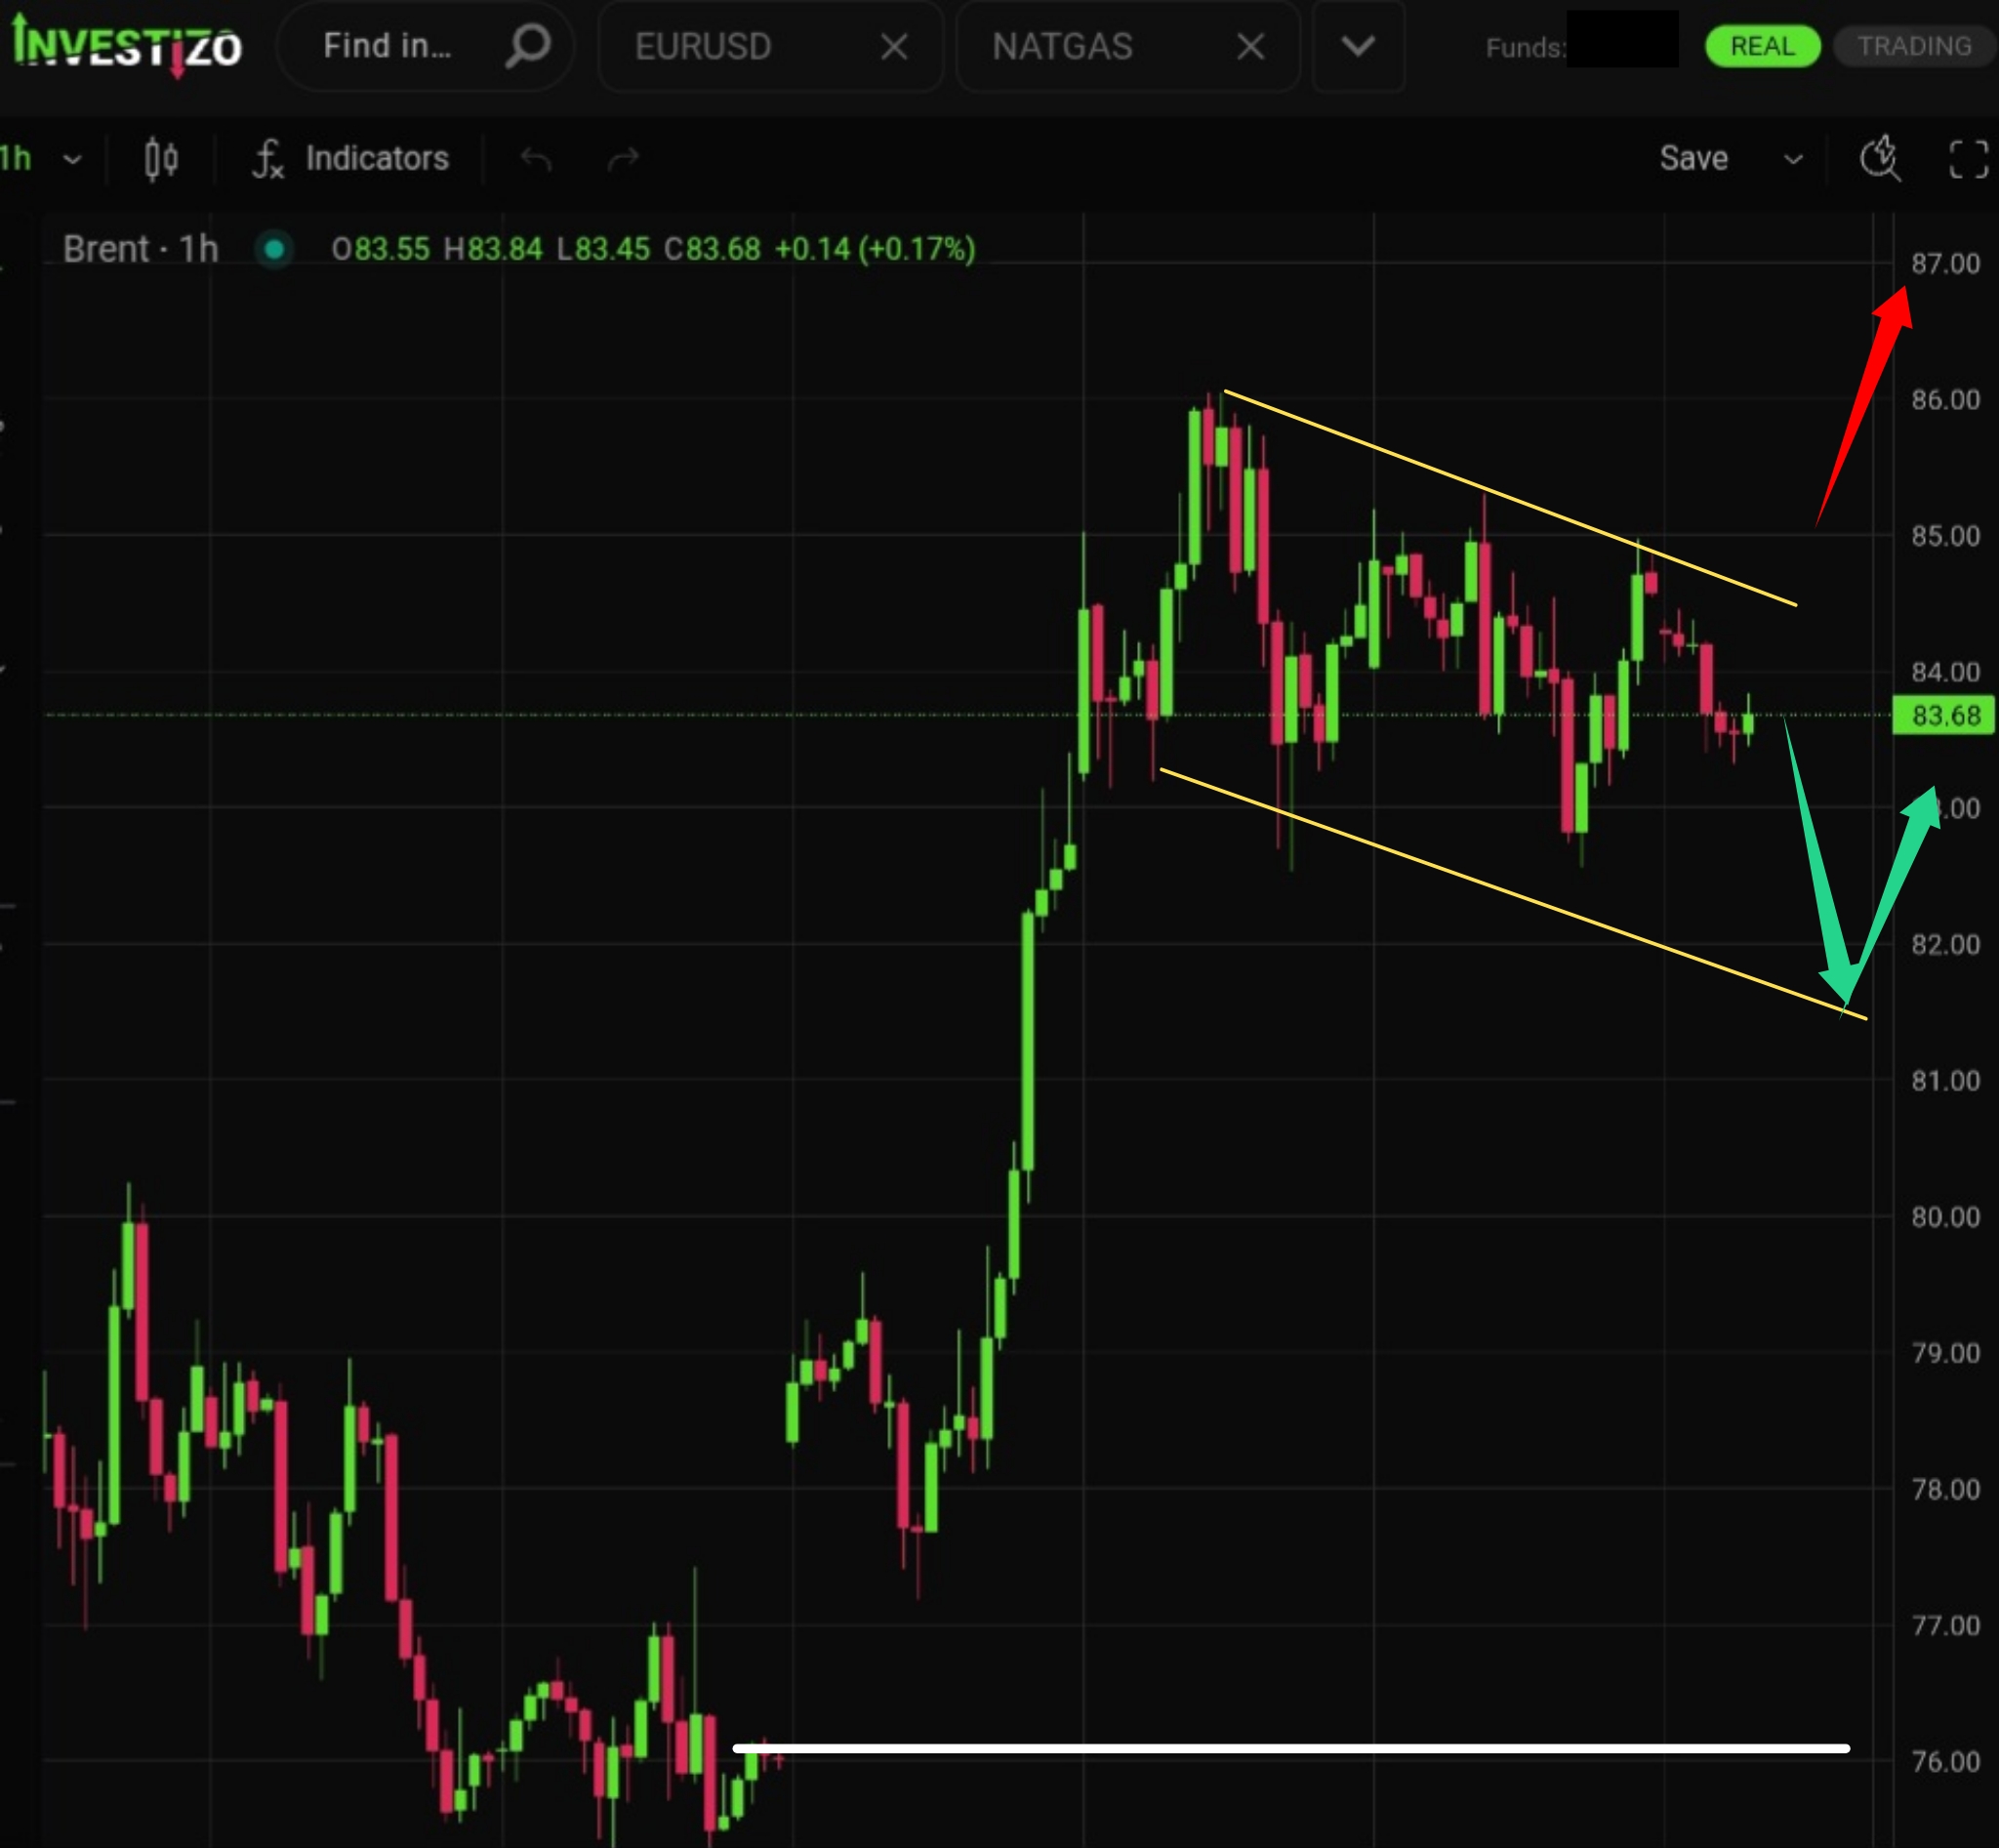
Oil is presumably breaking out of the “bull flag” pattern, which may signal an impending upward impulse.
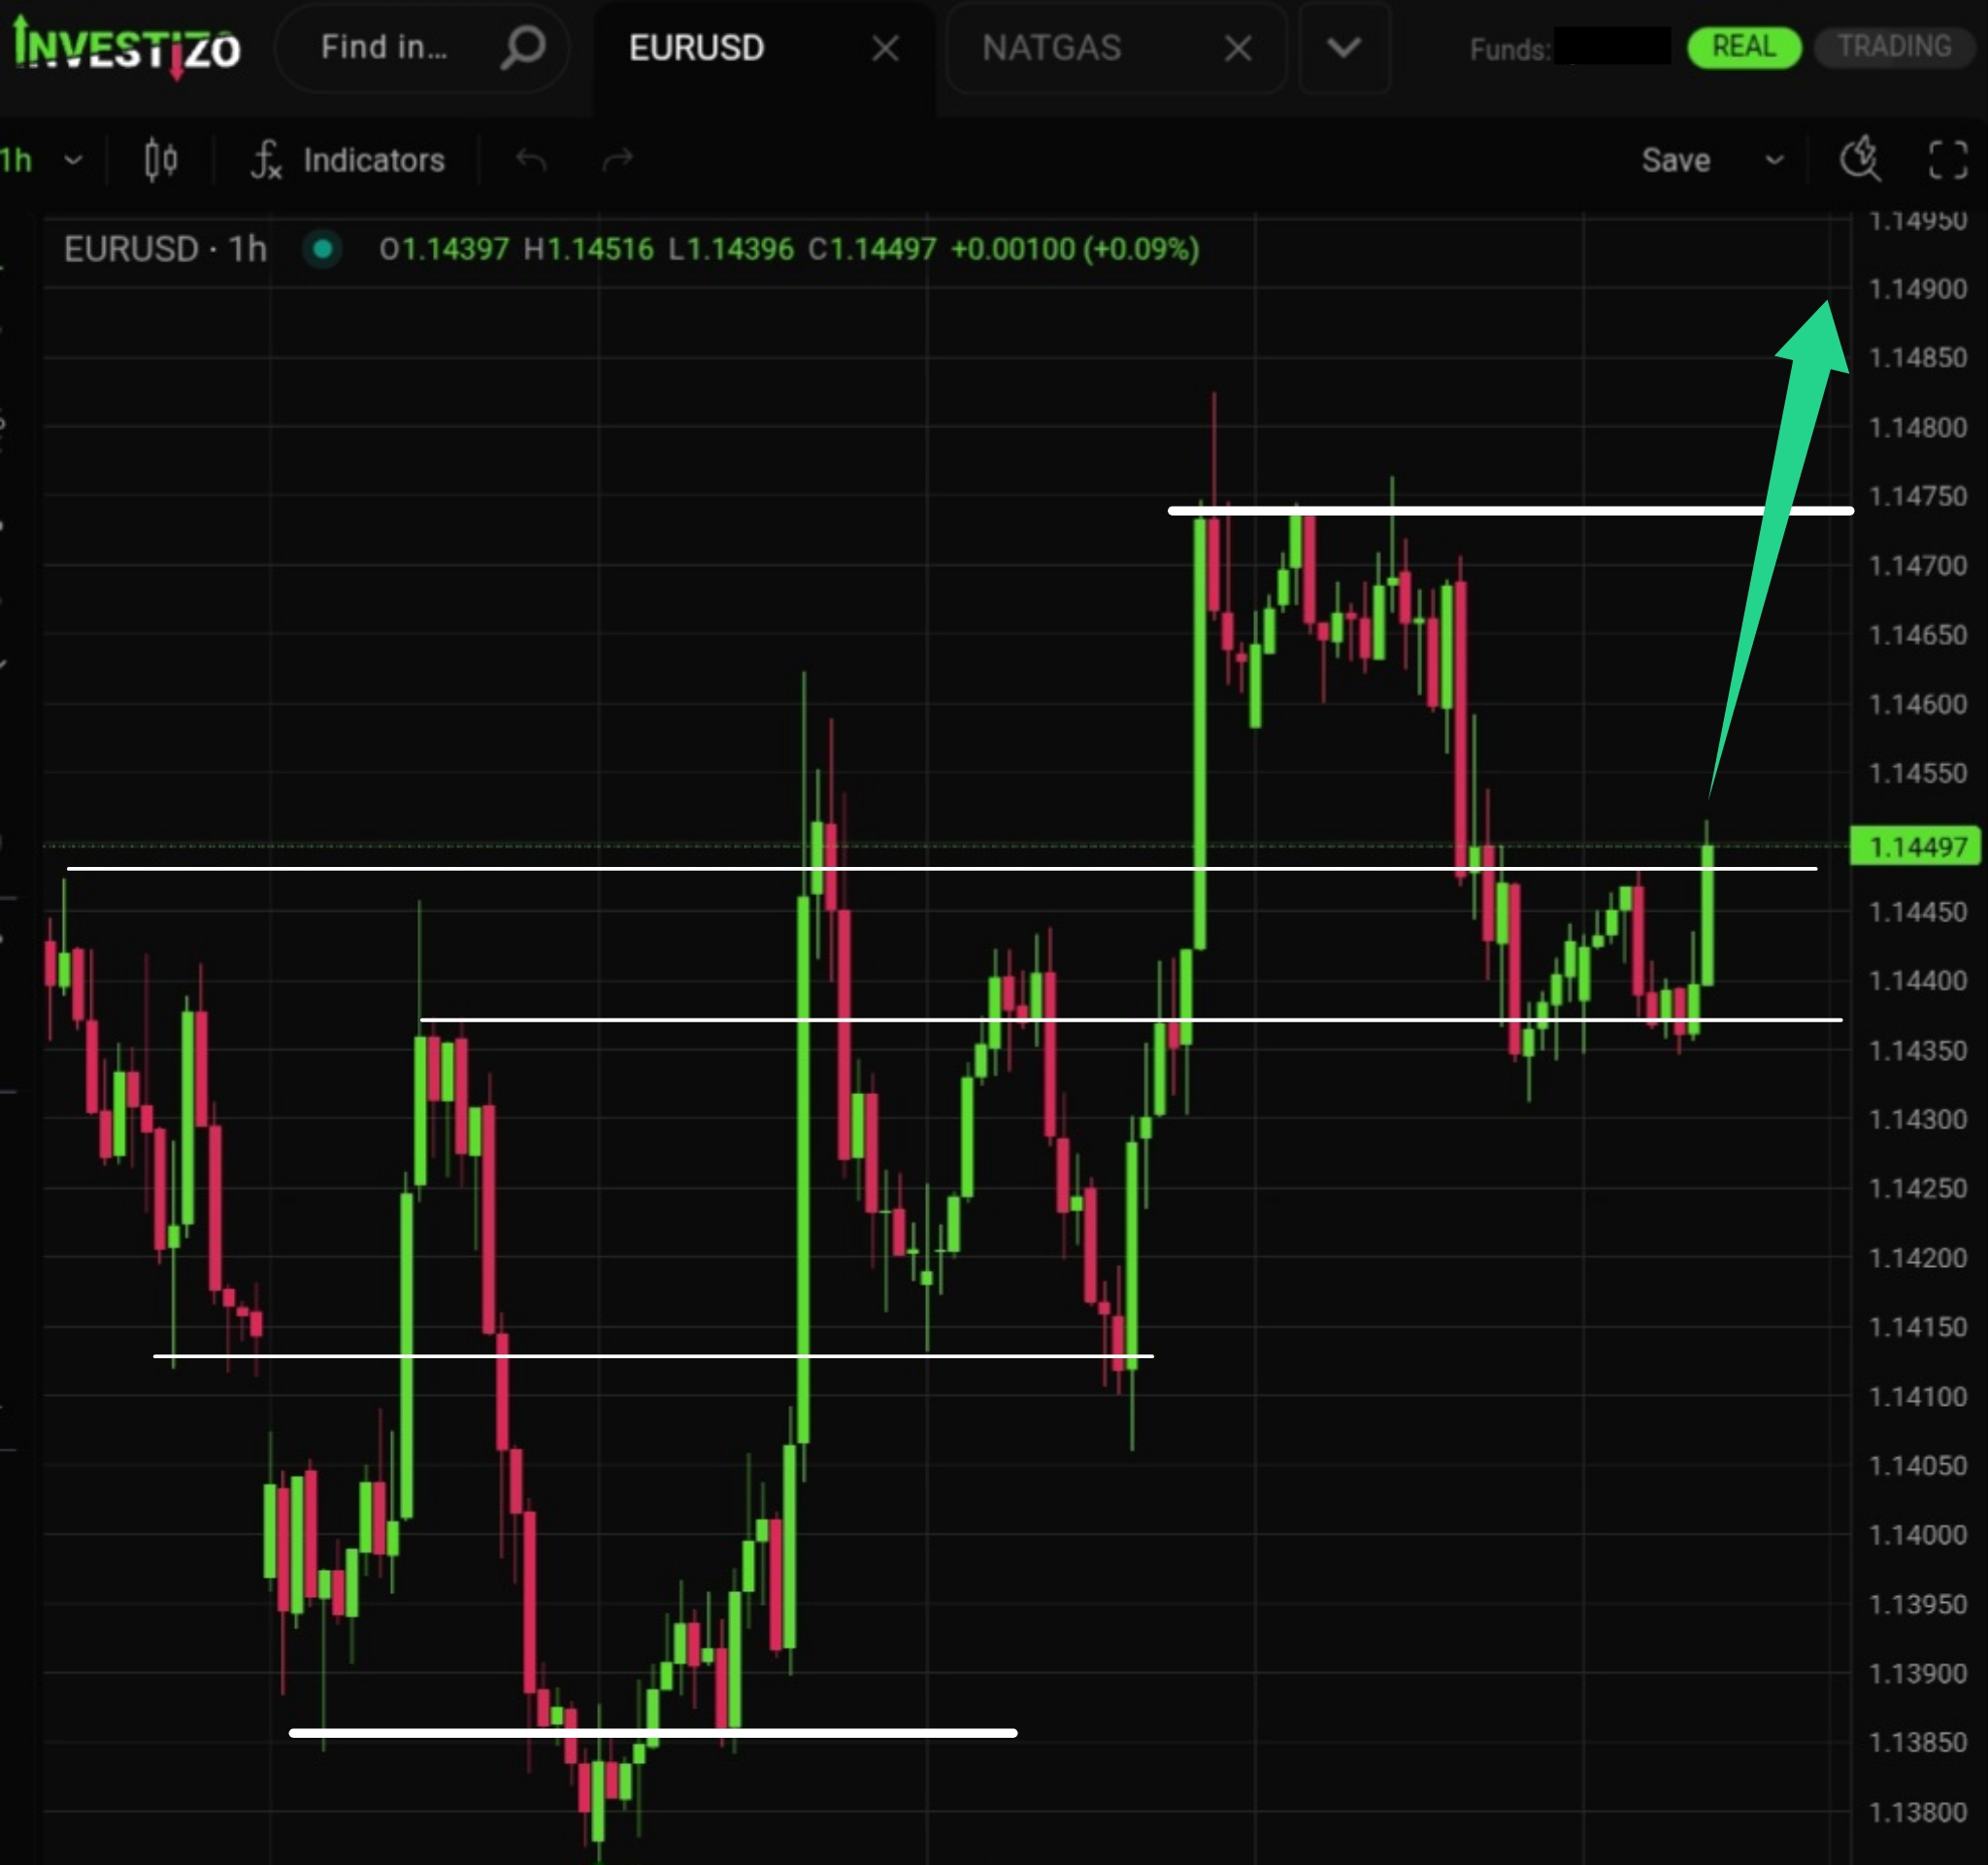
The pair has already completed a 5-wave upward structure. As we have experienced, the market rarely delivers a seventh wave.
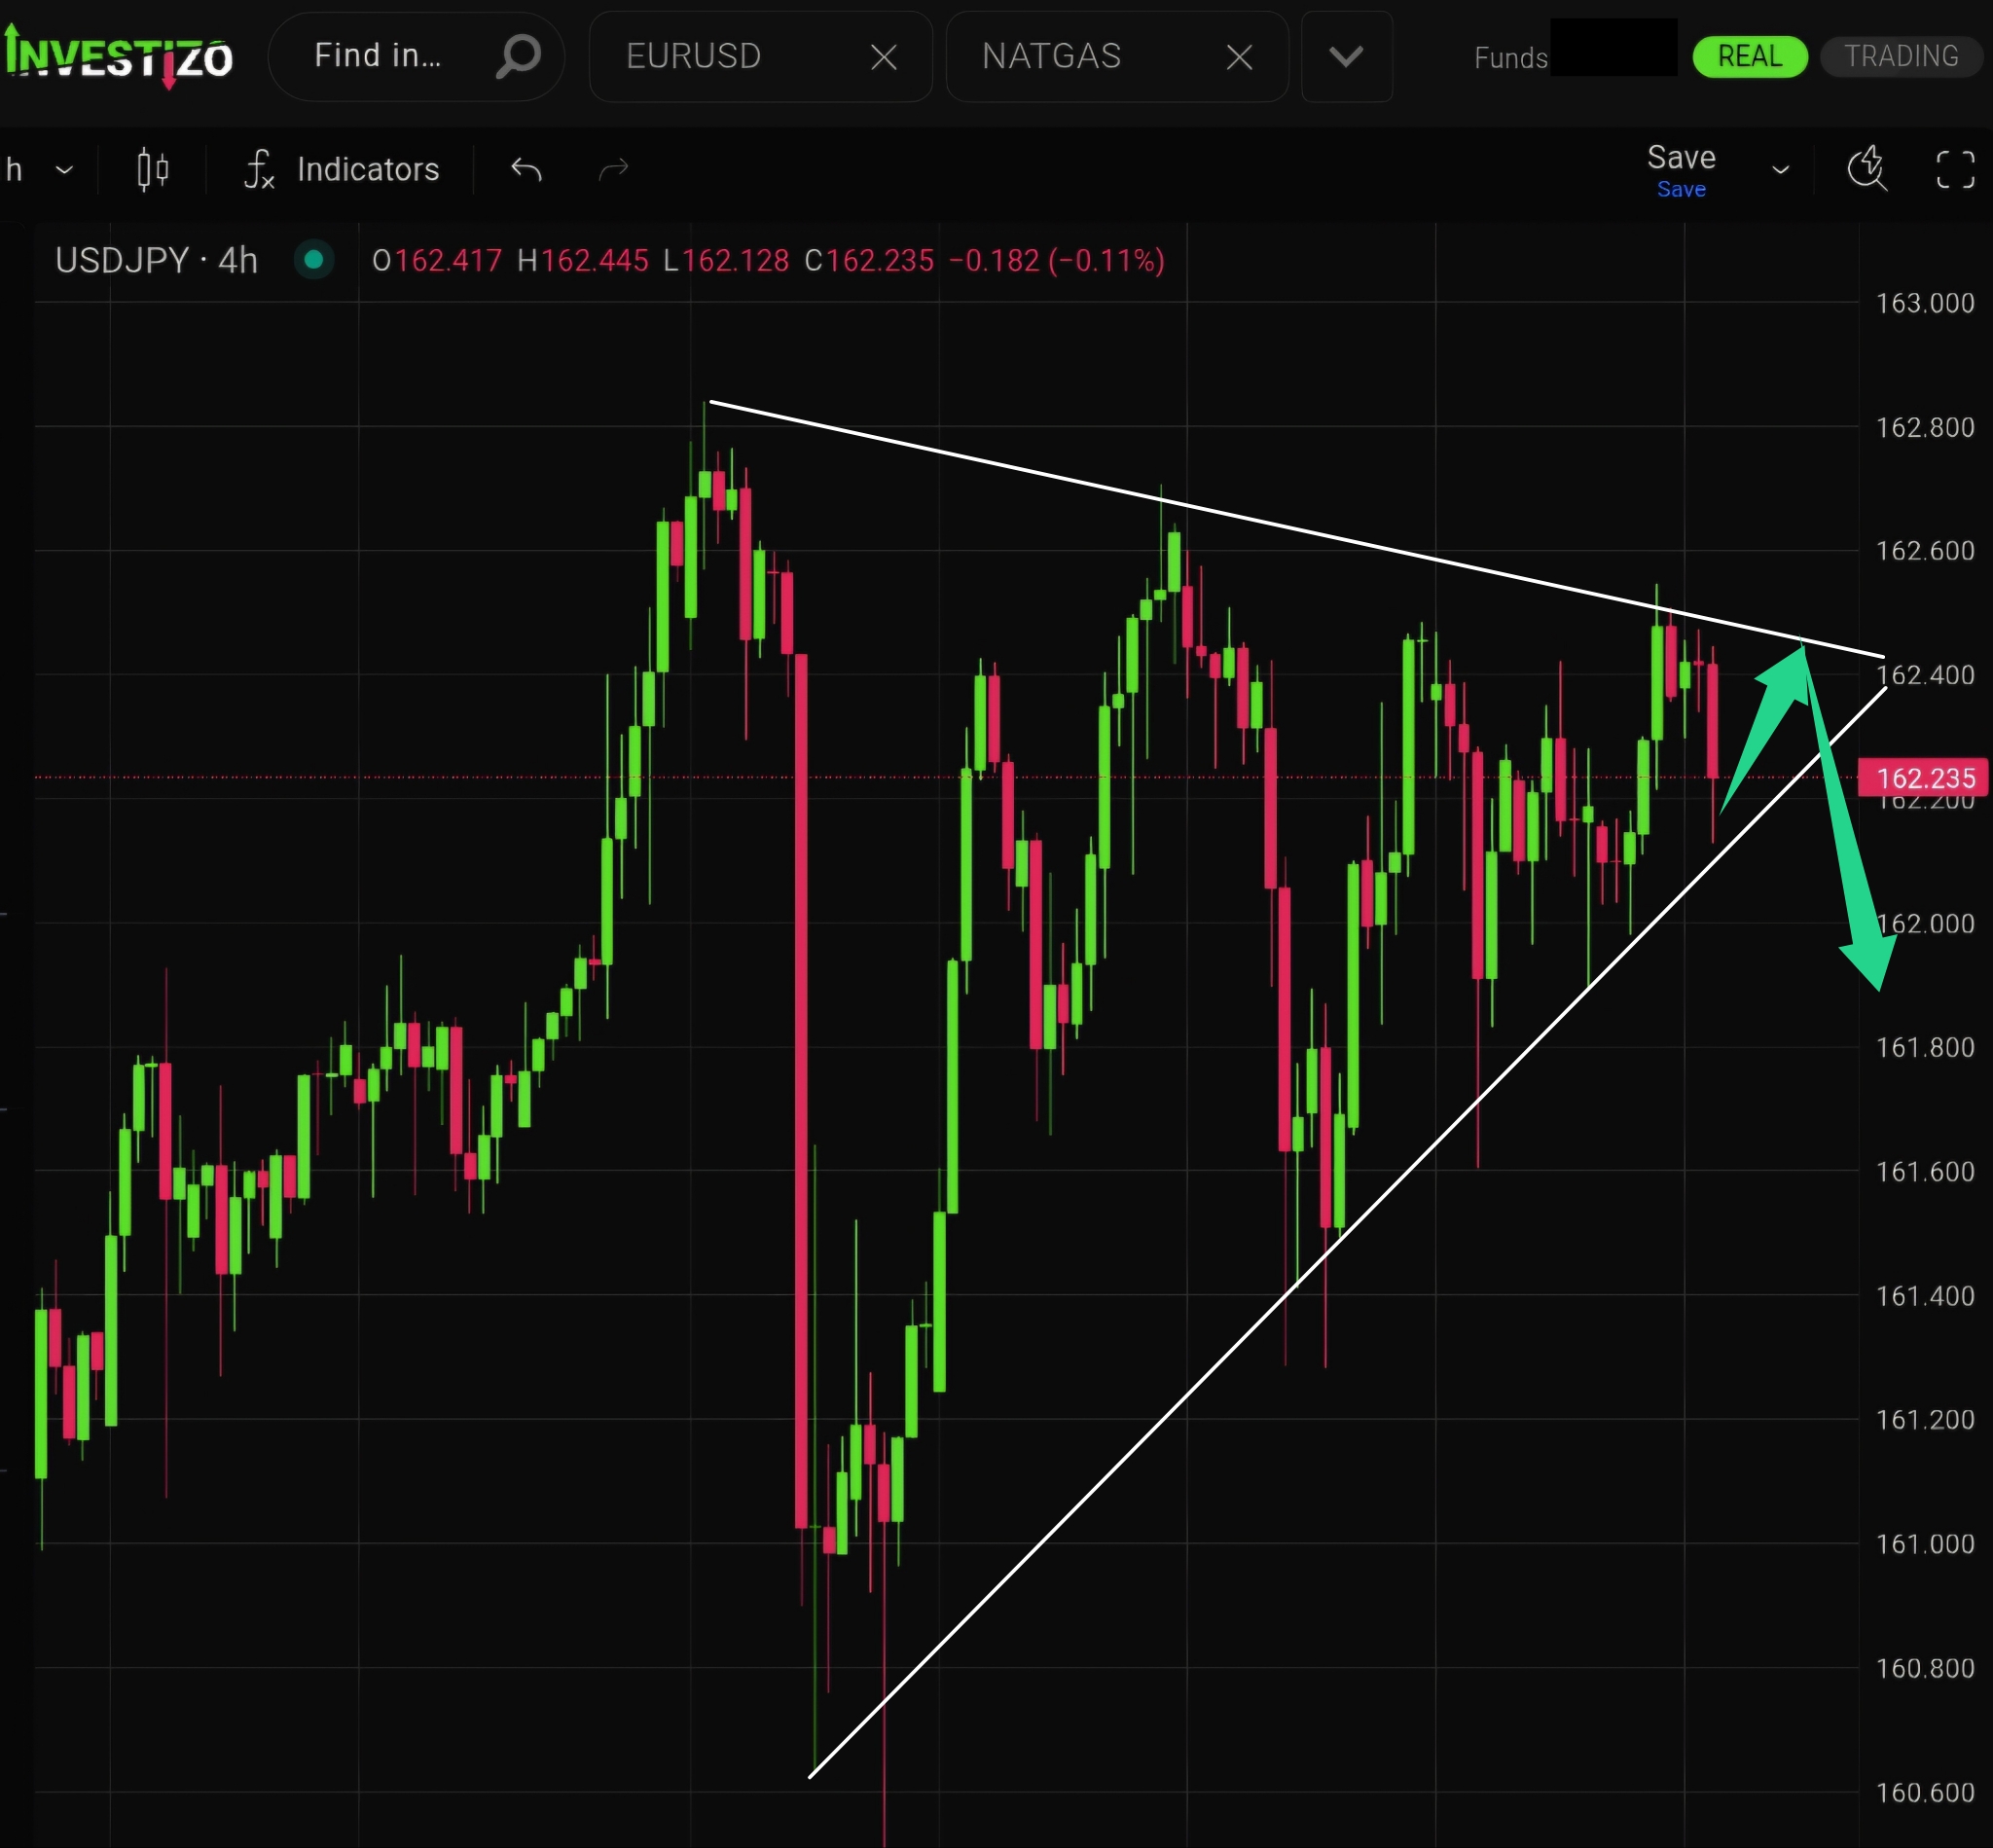
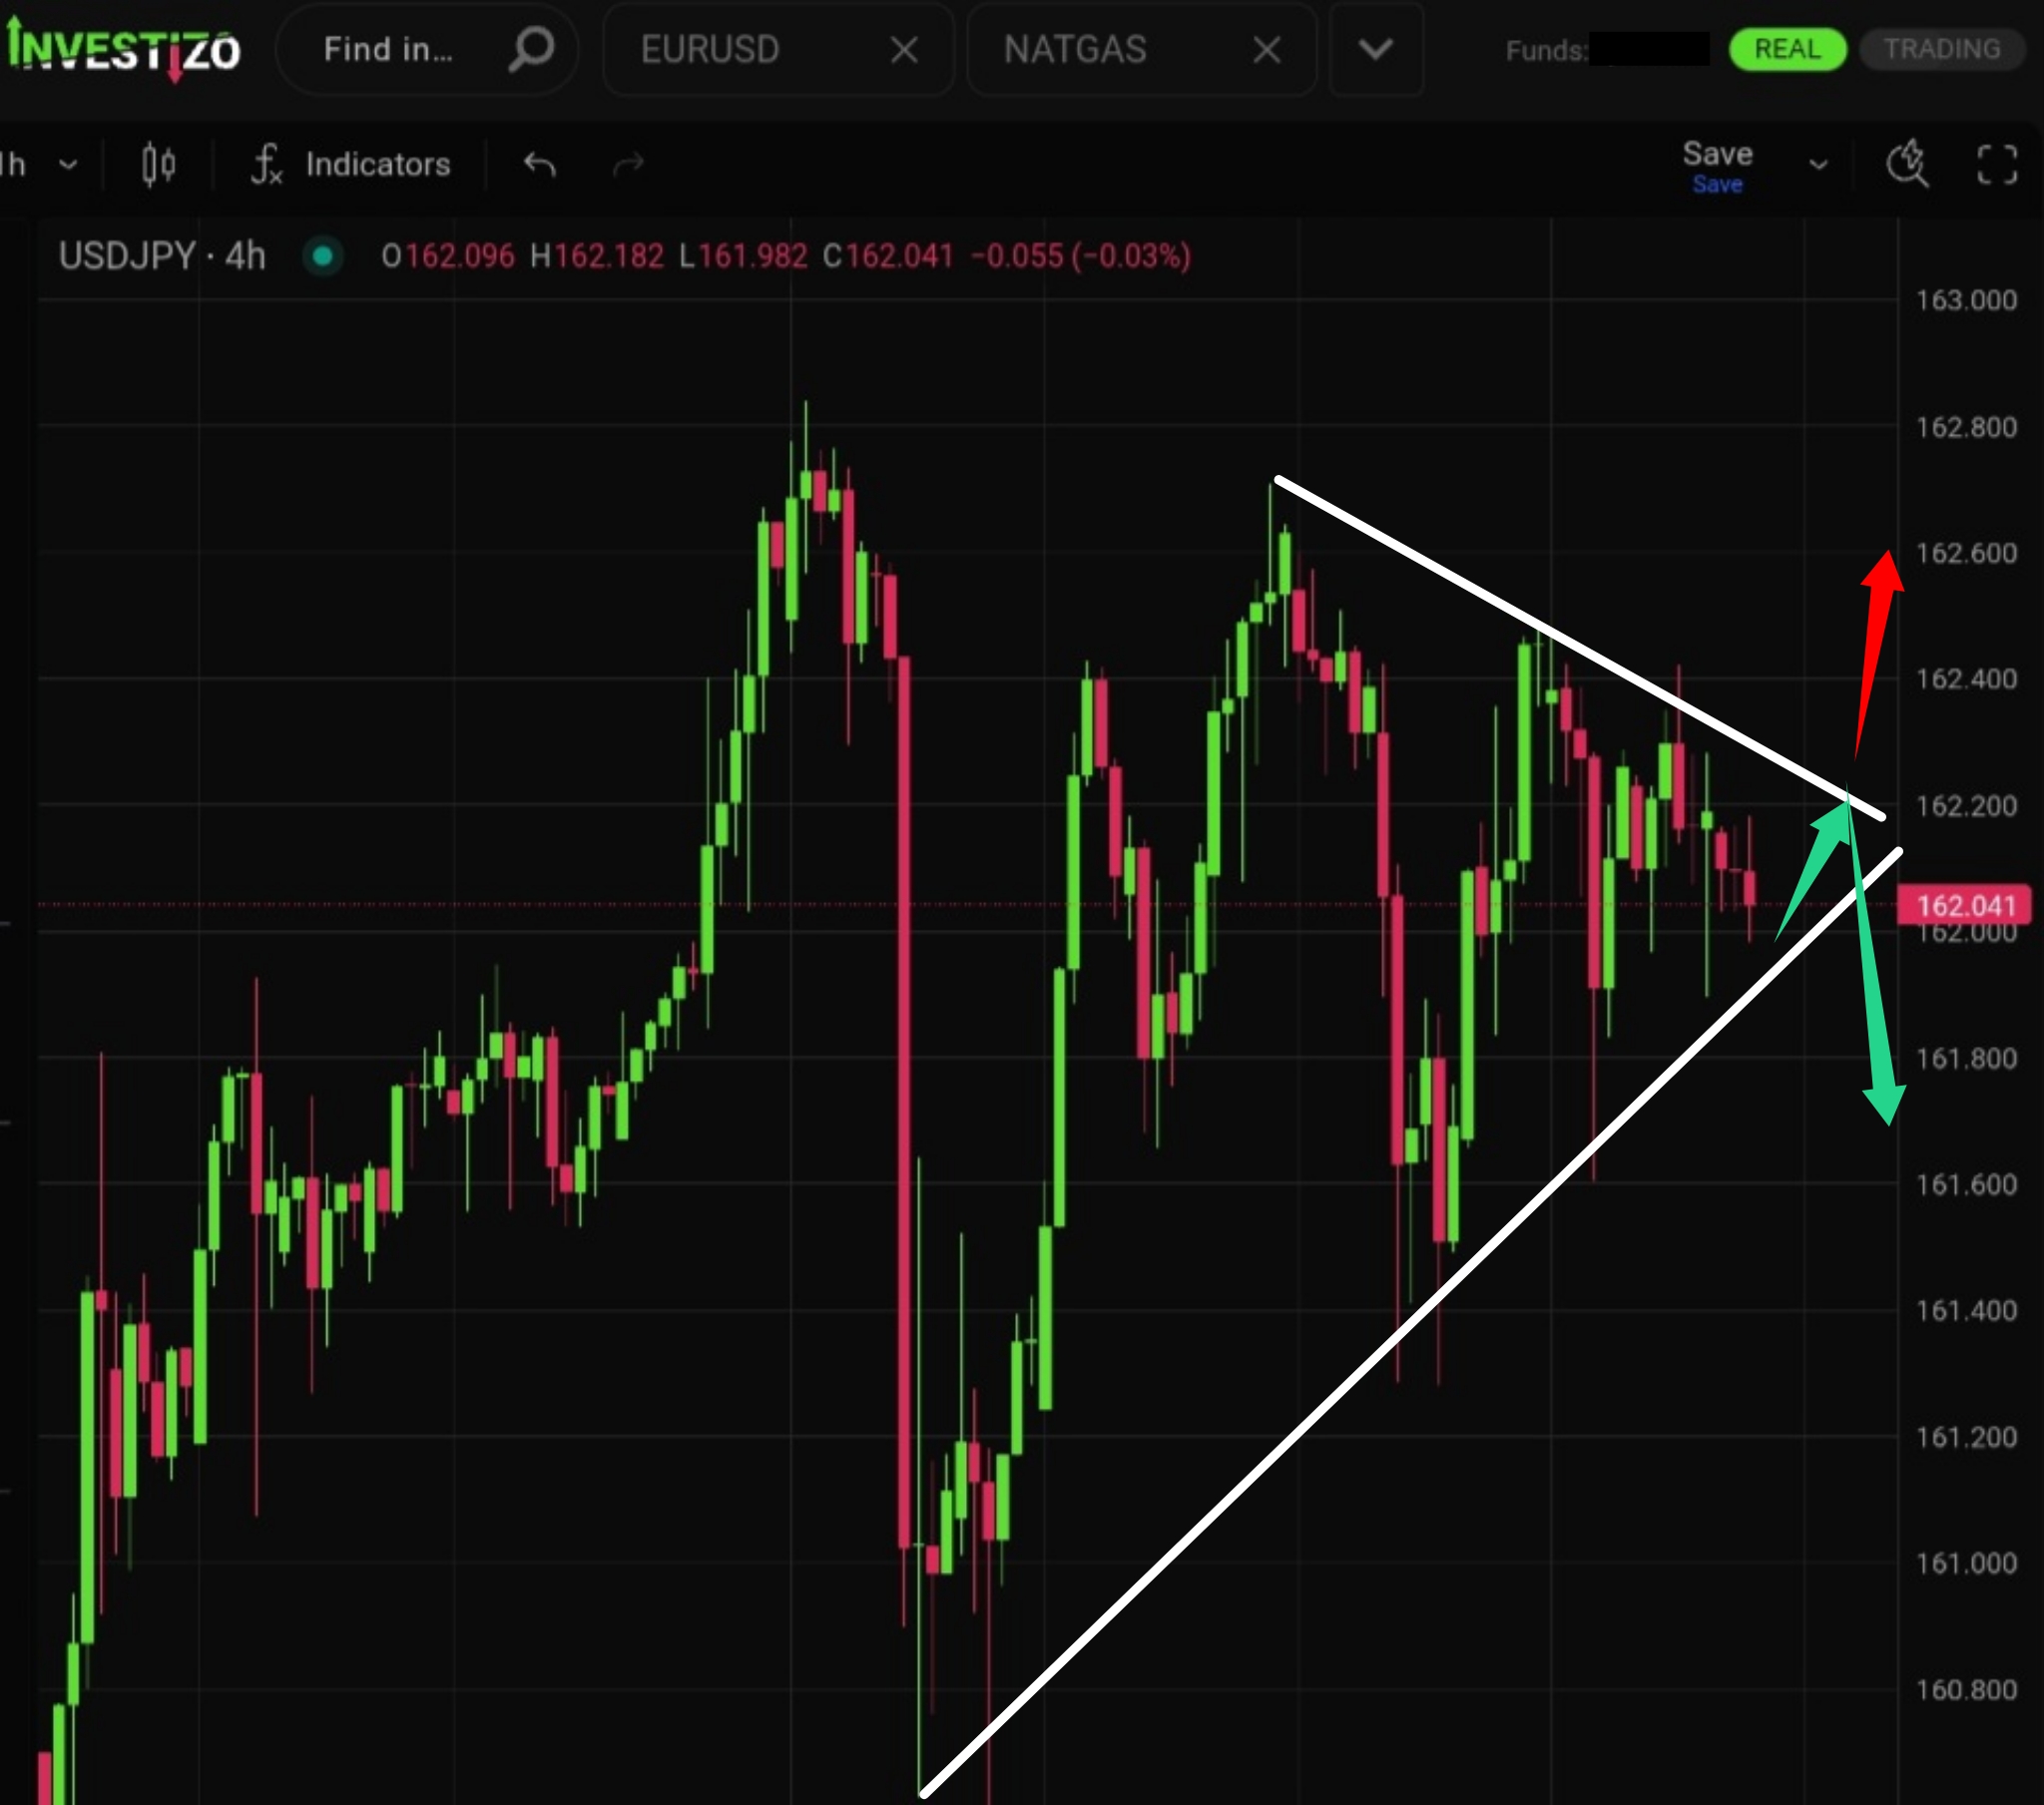
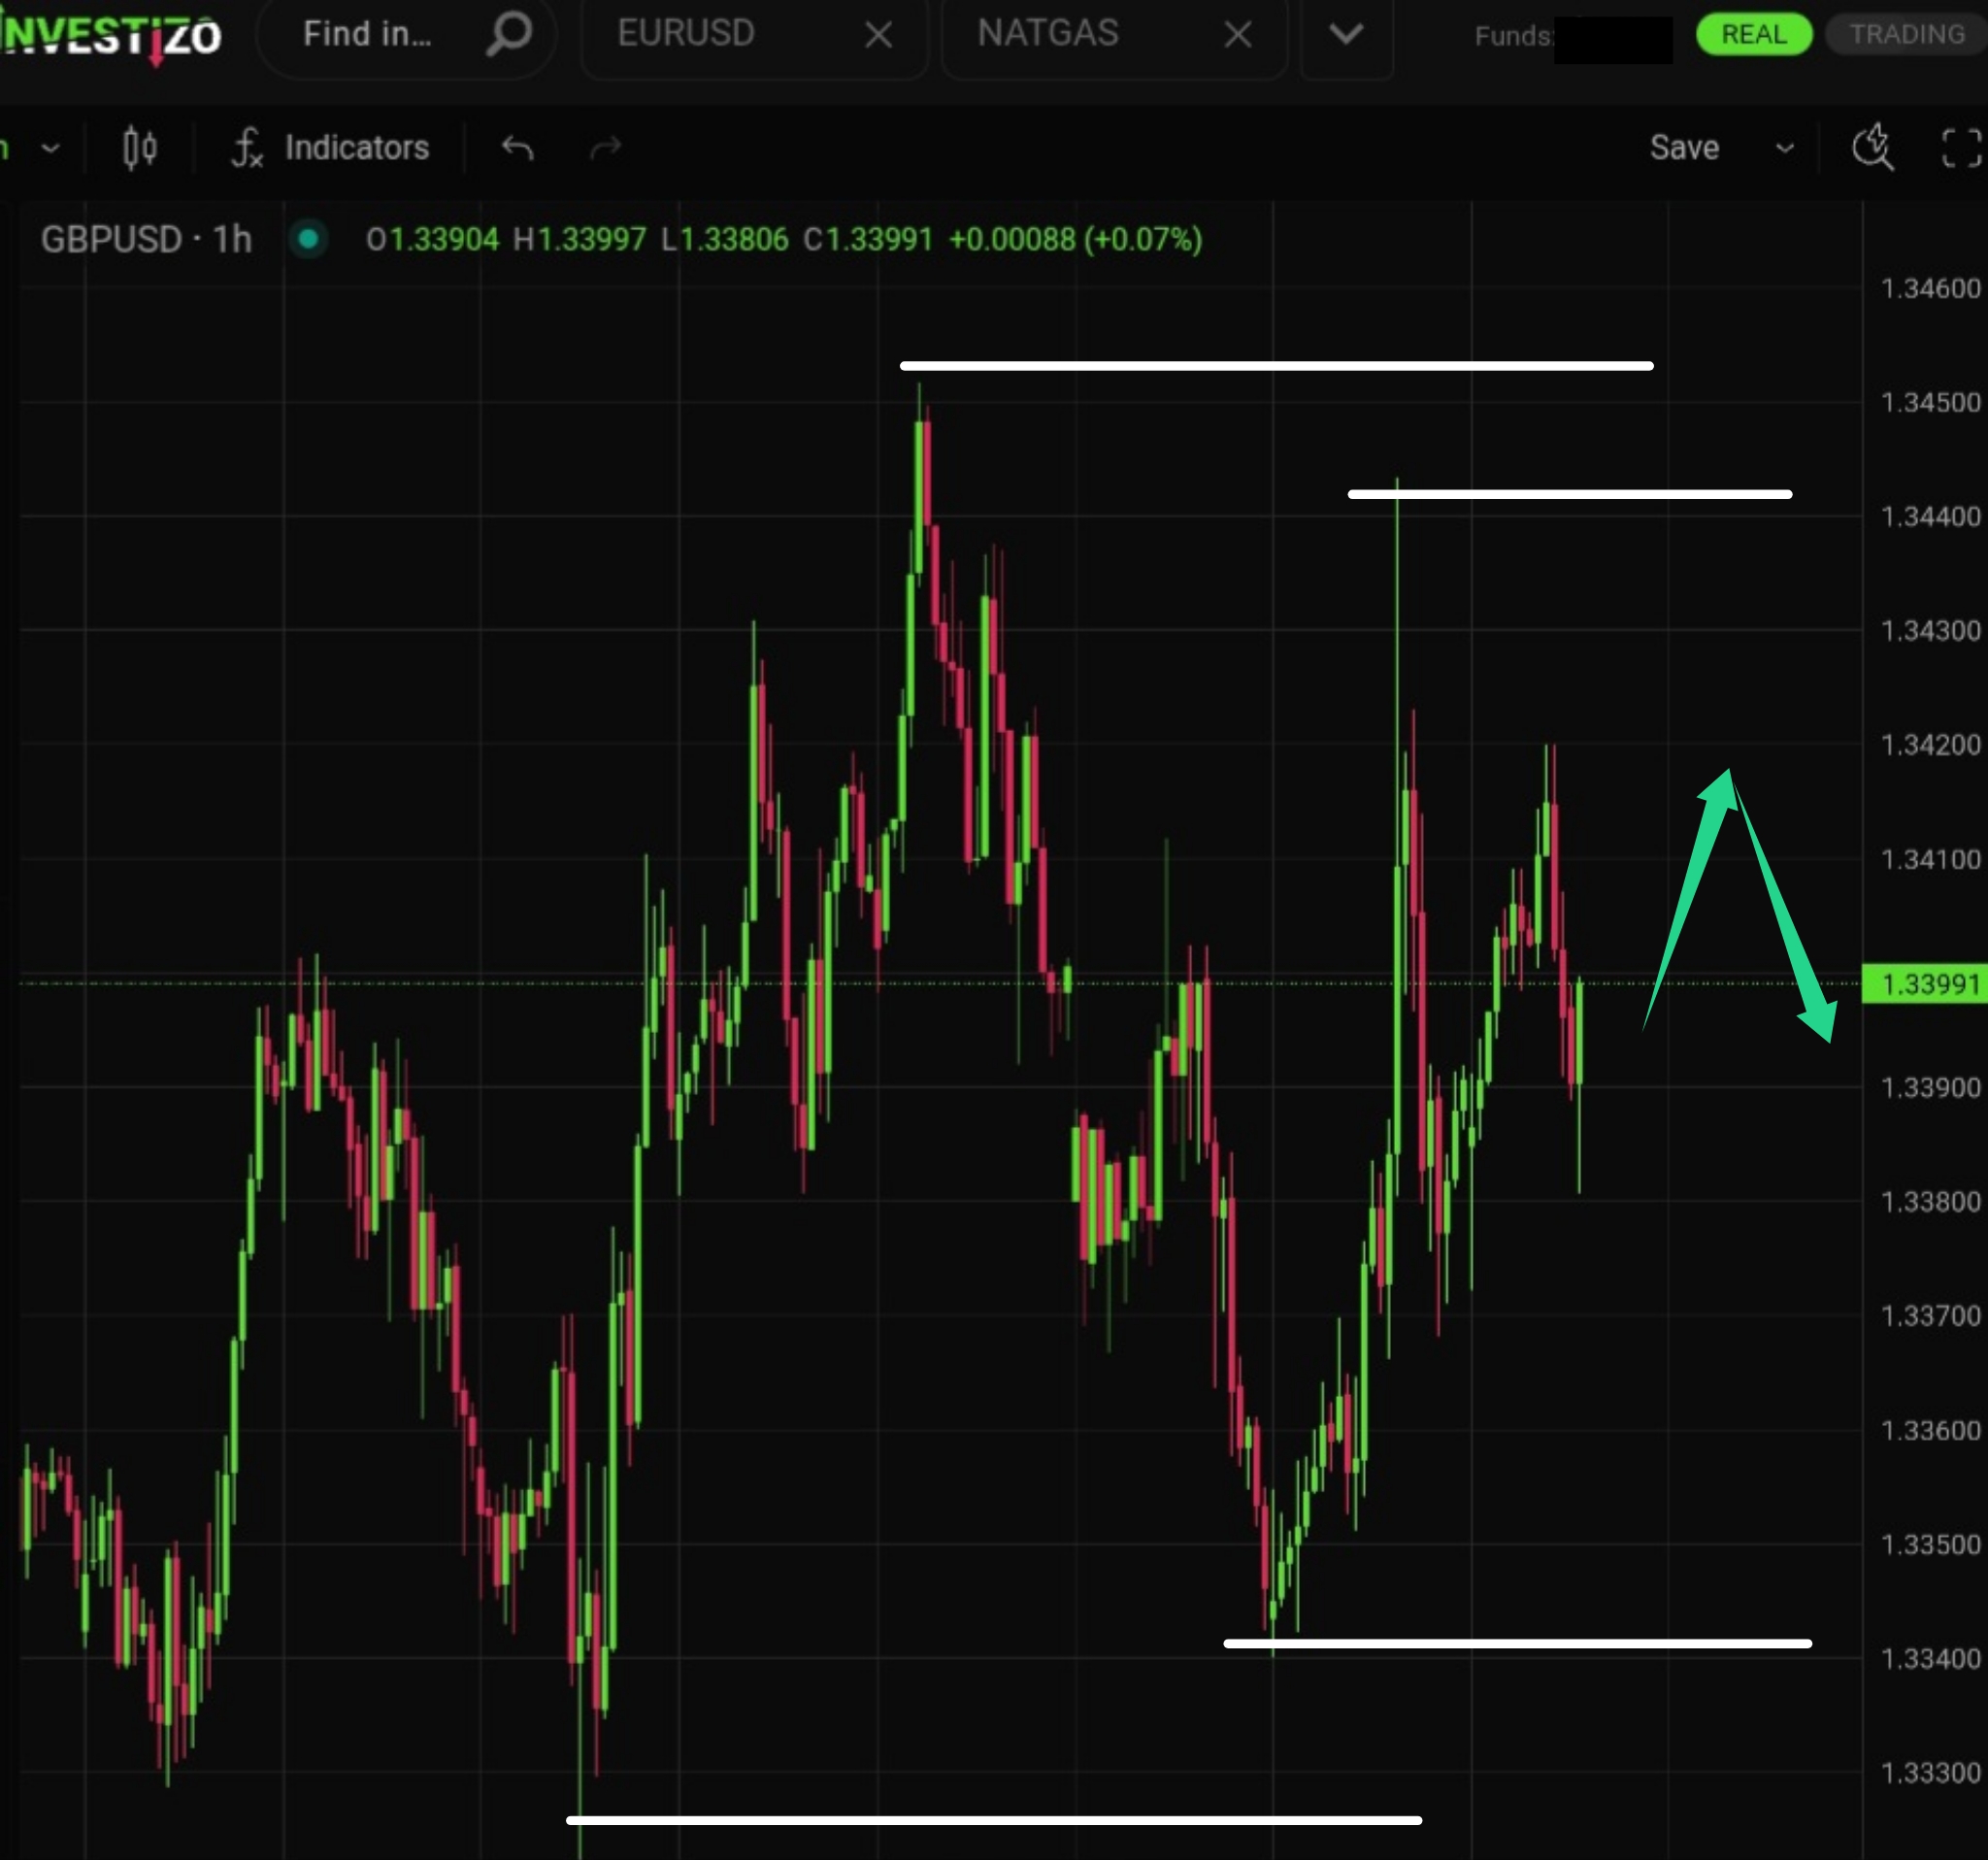
The pair is approaching the completion of the full triangle fill, within which price has been consolidating throughout the week.
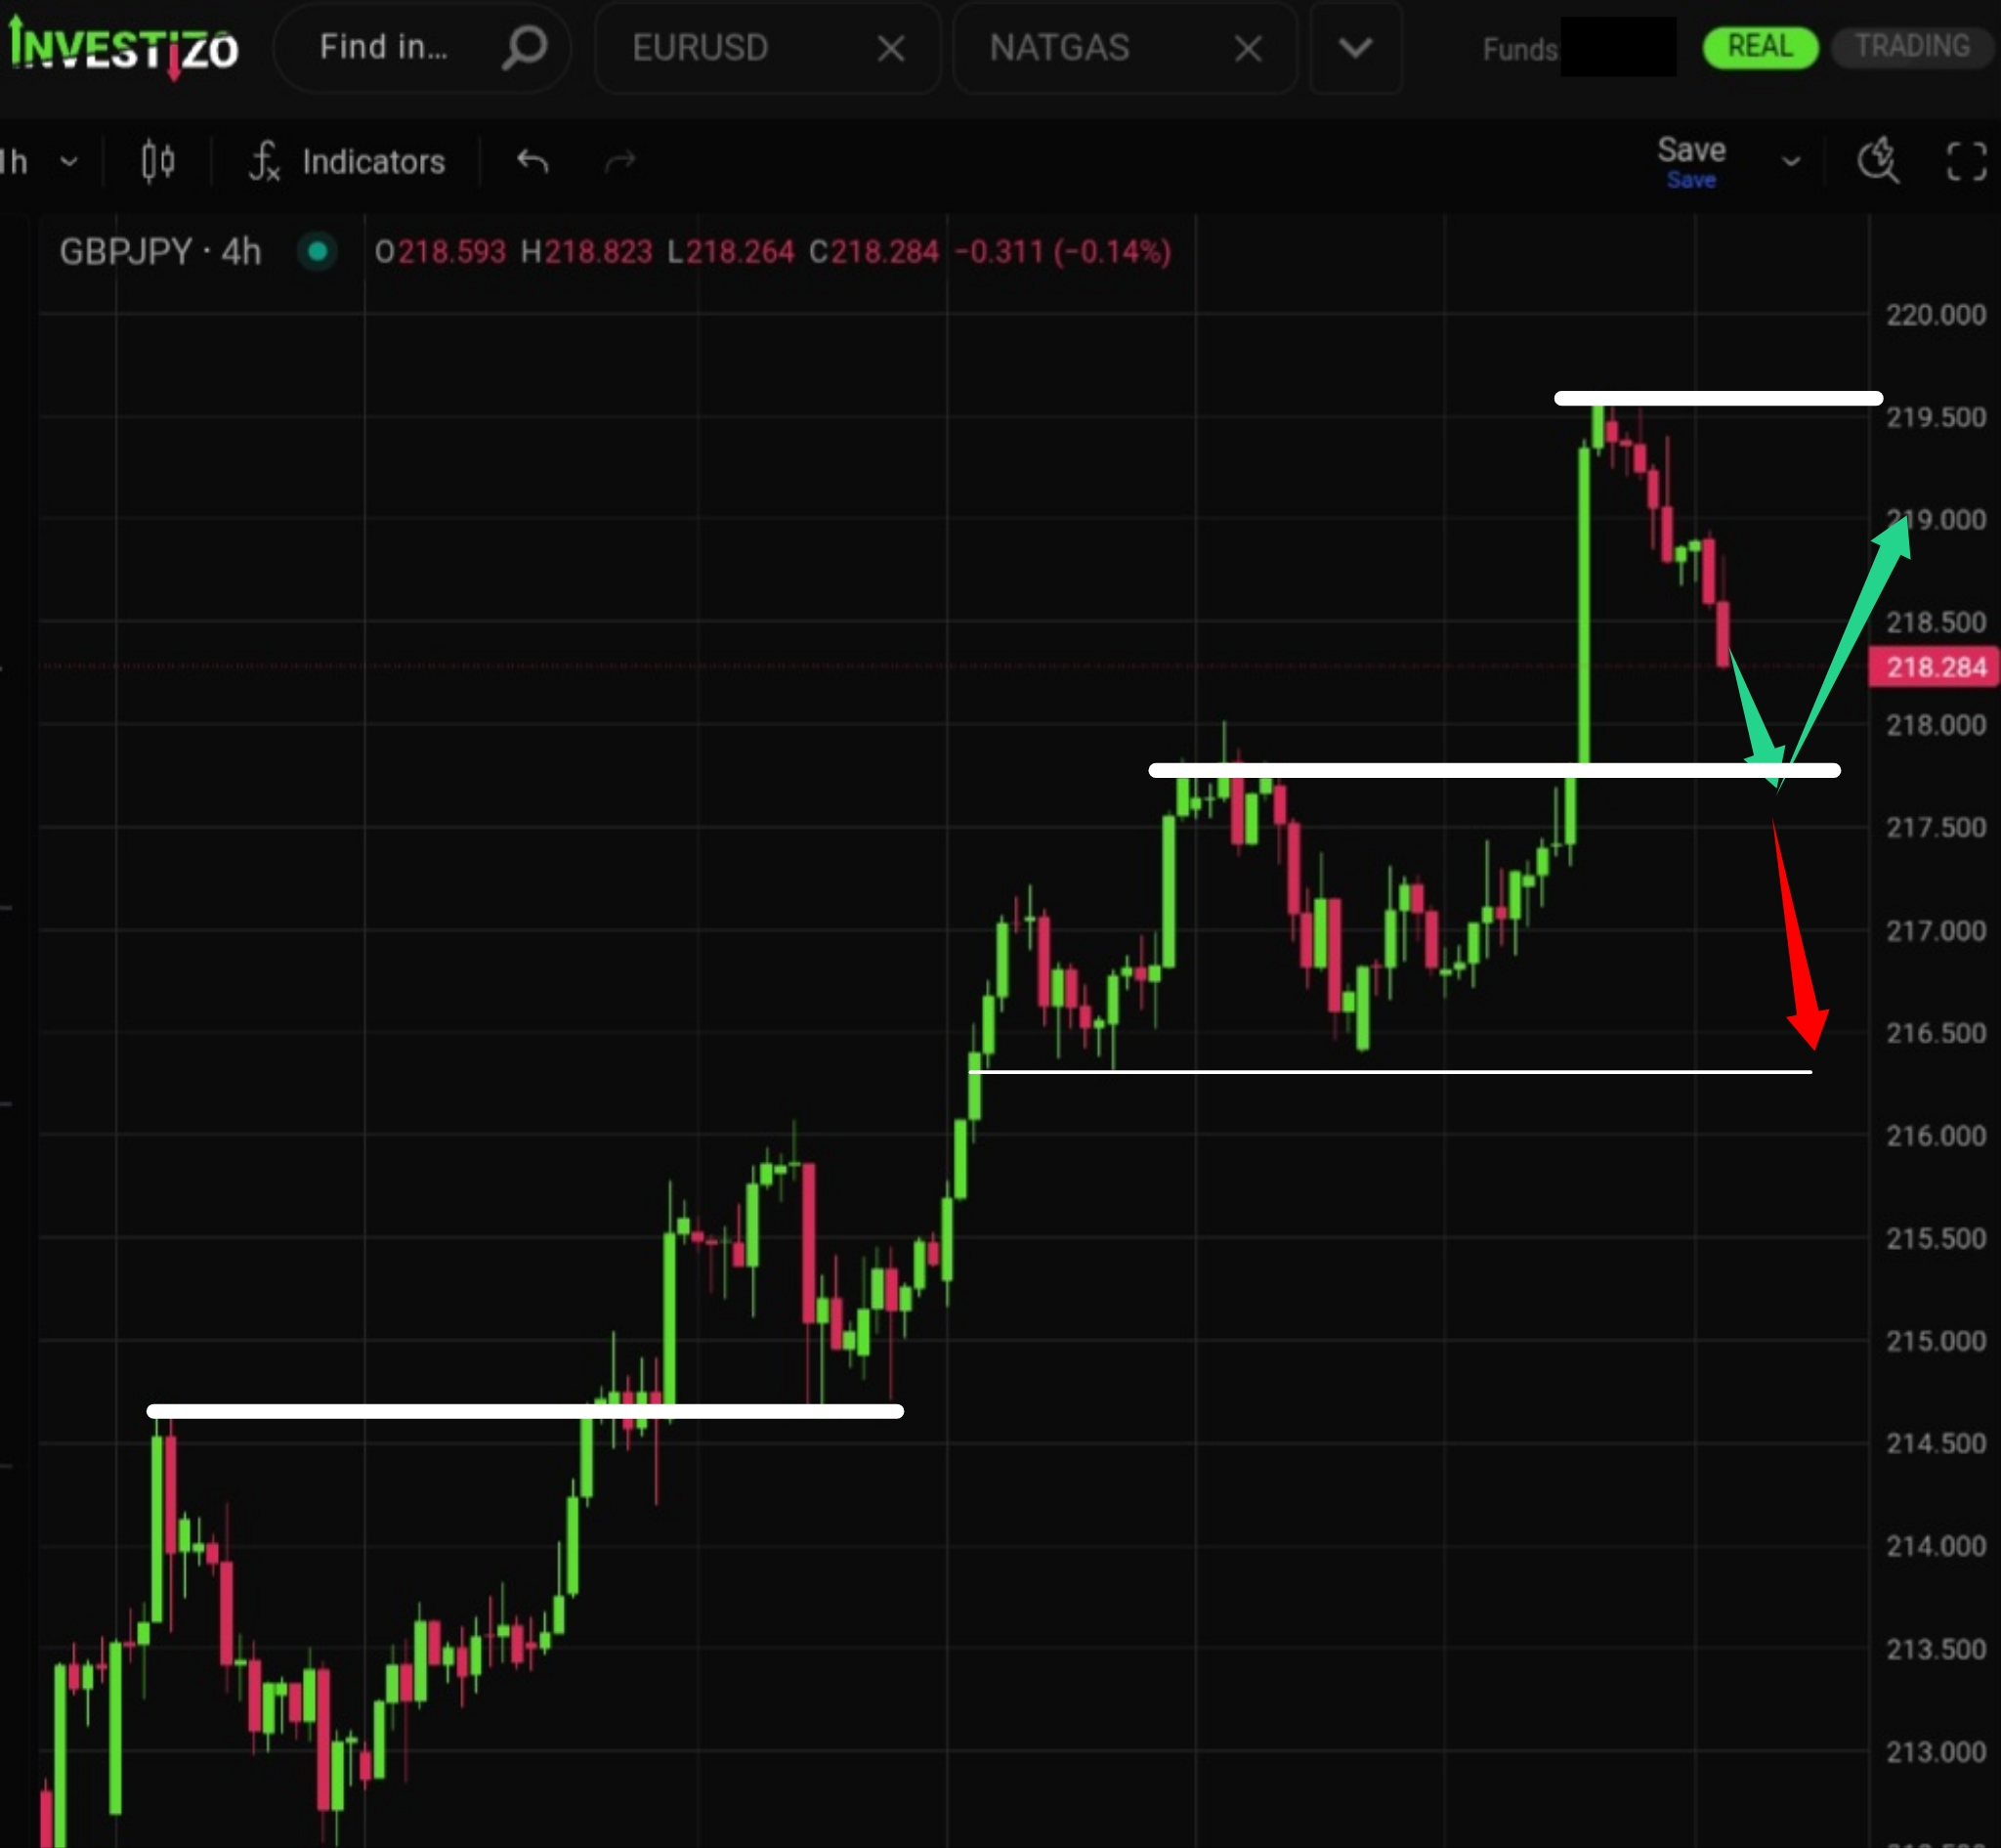
The downward technical correction phase appears to have concluded, enabling buyers to actively develop a new upward trending swing.
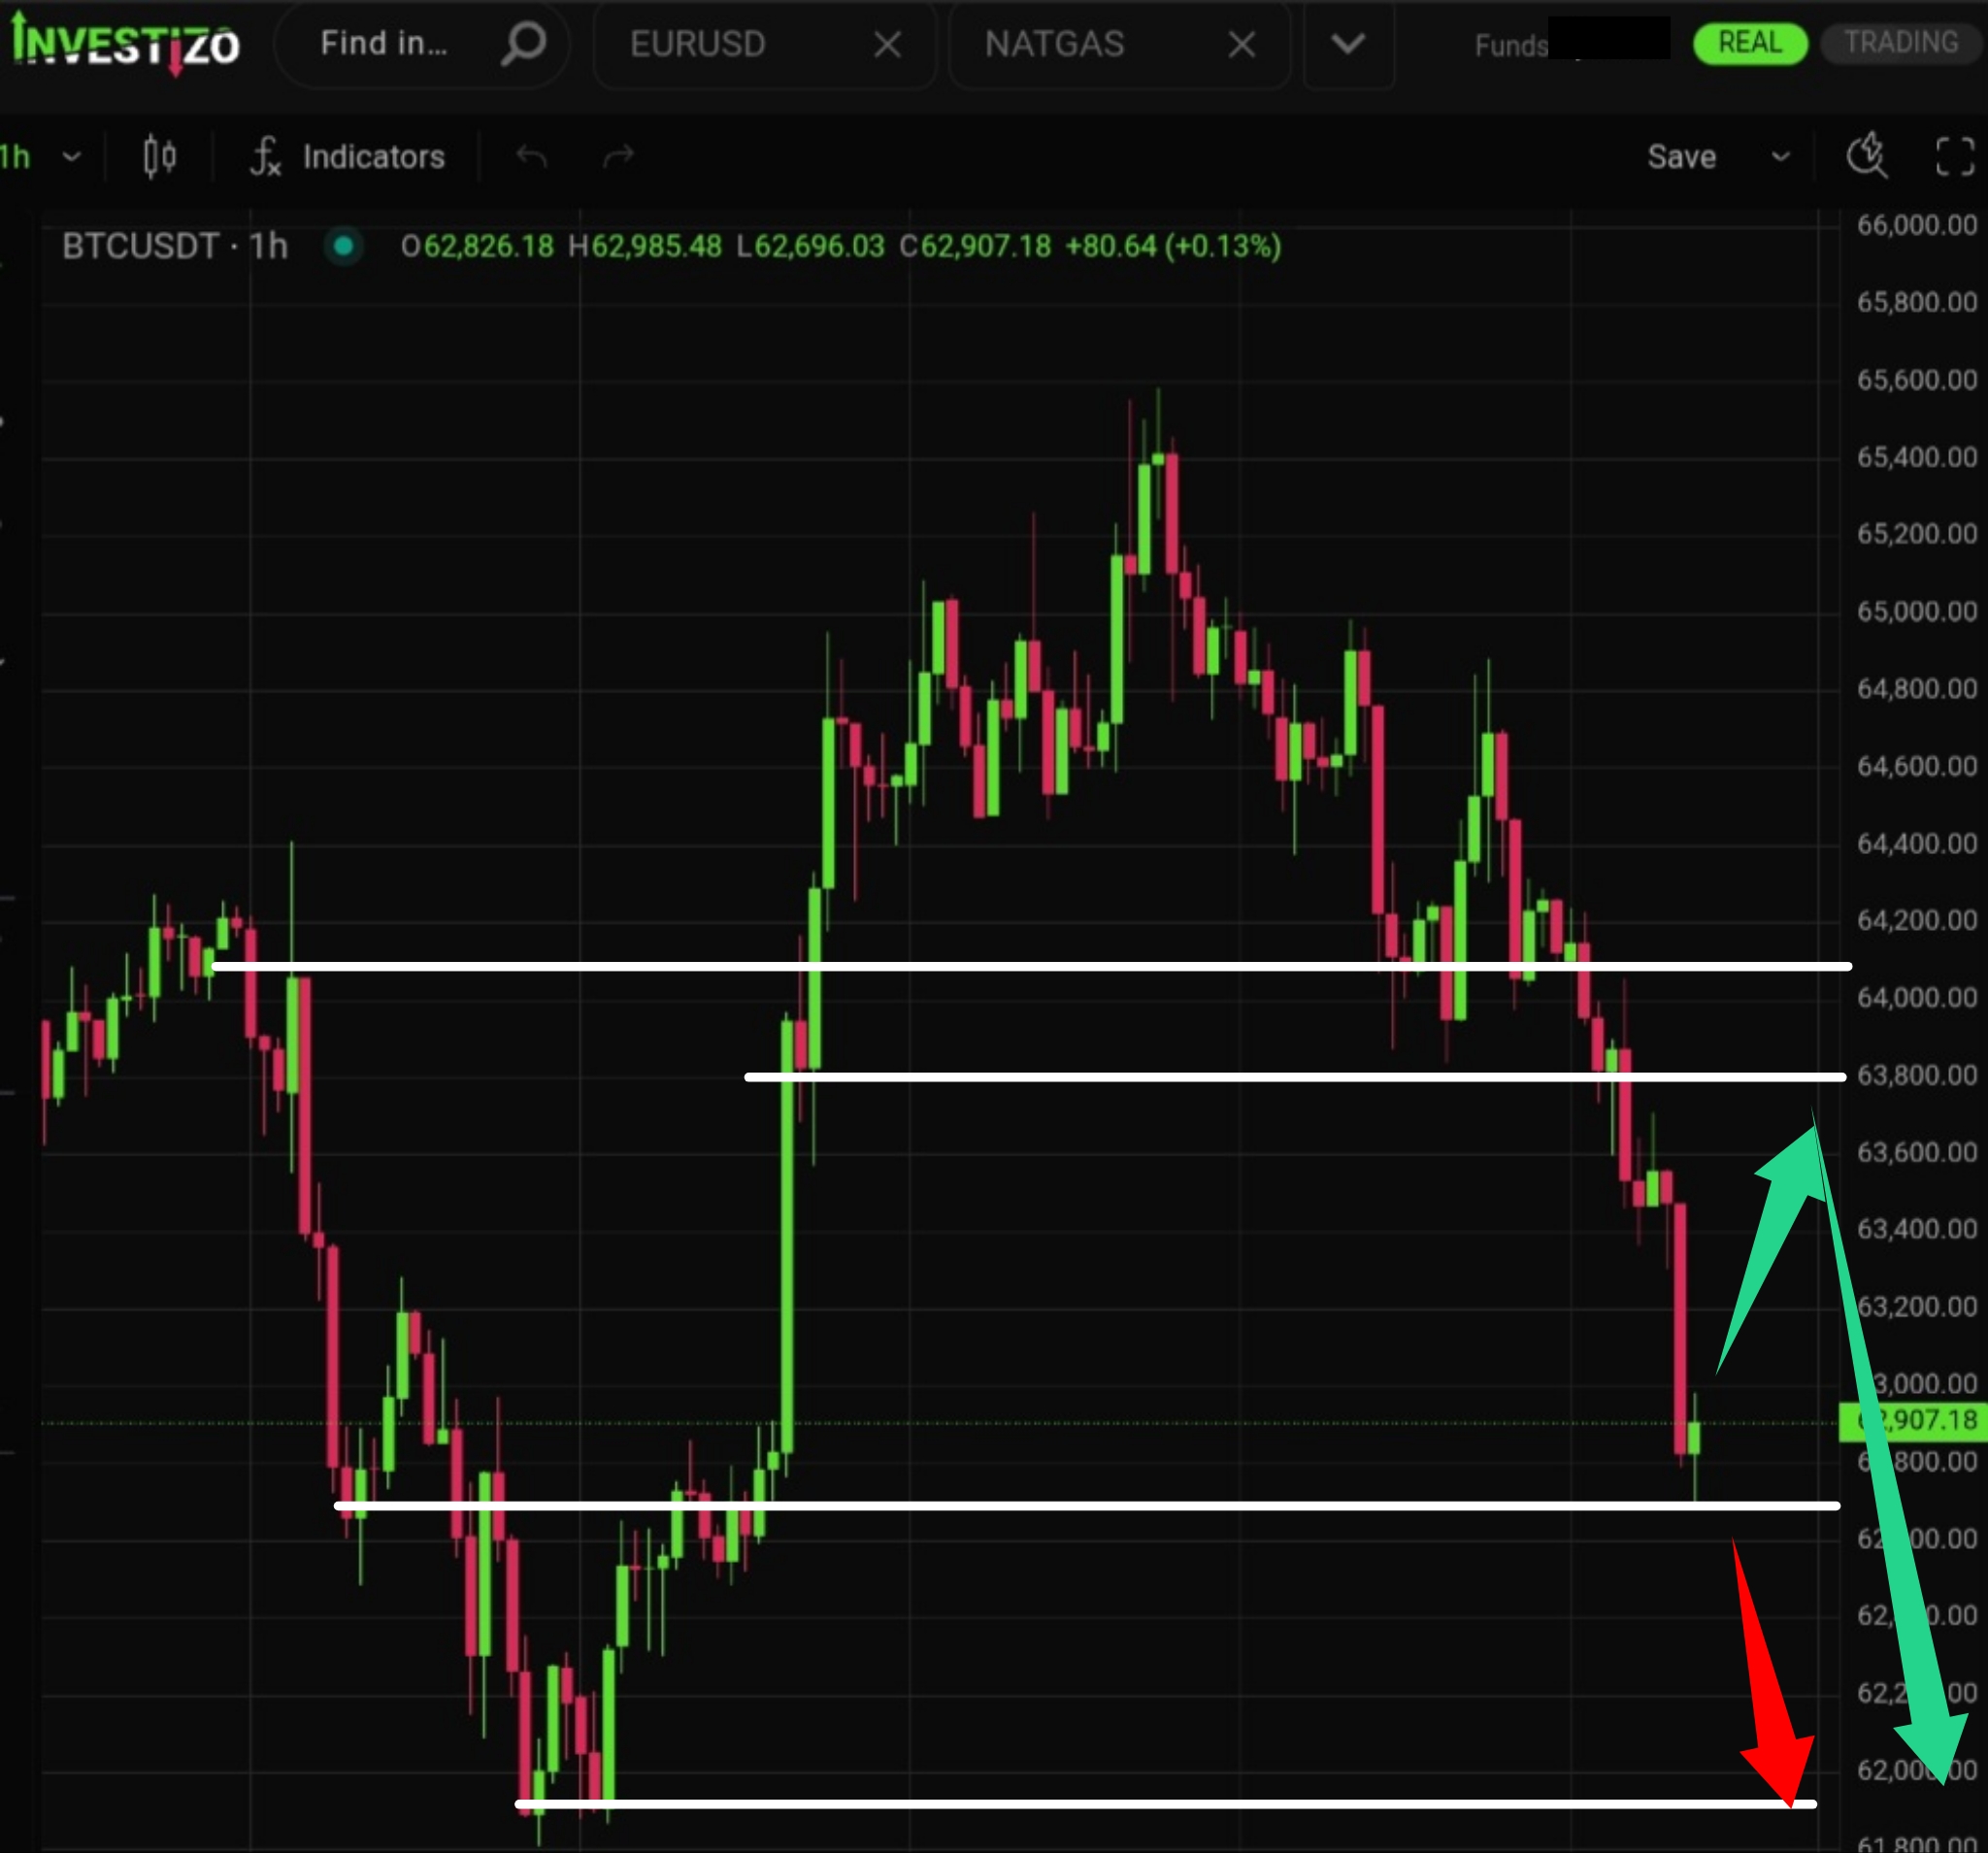
Bitcoin (BTC/USD) trades at 62,900 this Friday morning, retracing from its mid-week breakout attempt as political friction in Washington dampens speculative momentum.
Brent Crude trades at 82.95 this Friday morning, consolidating for a fourth consecutive session within the 83.00 to 85.00 corridor.
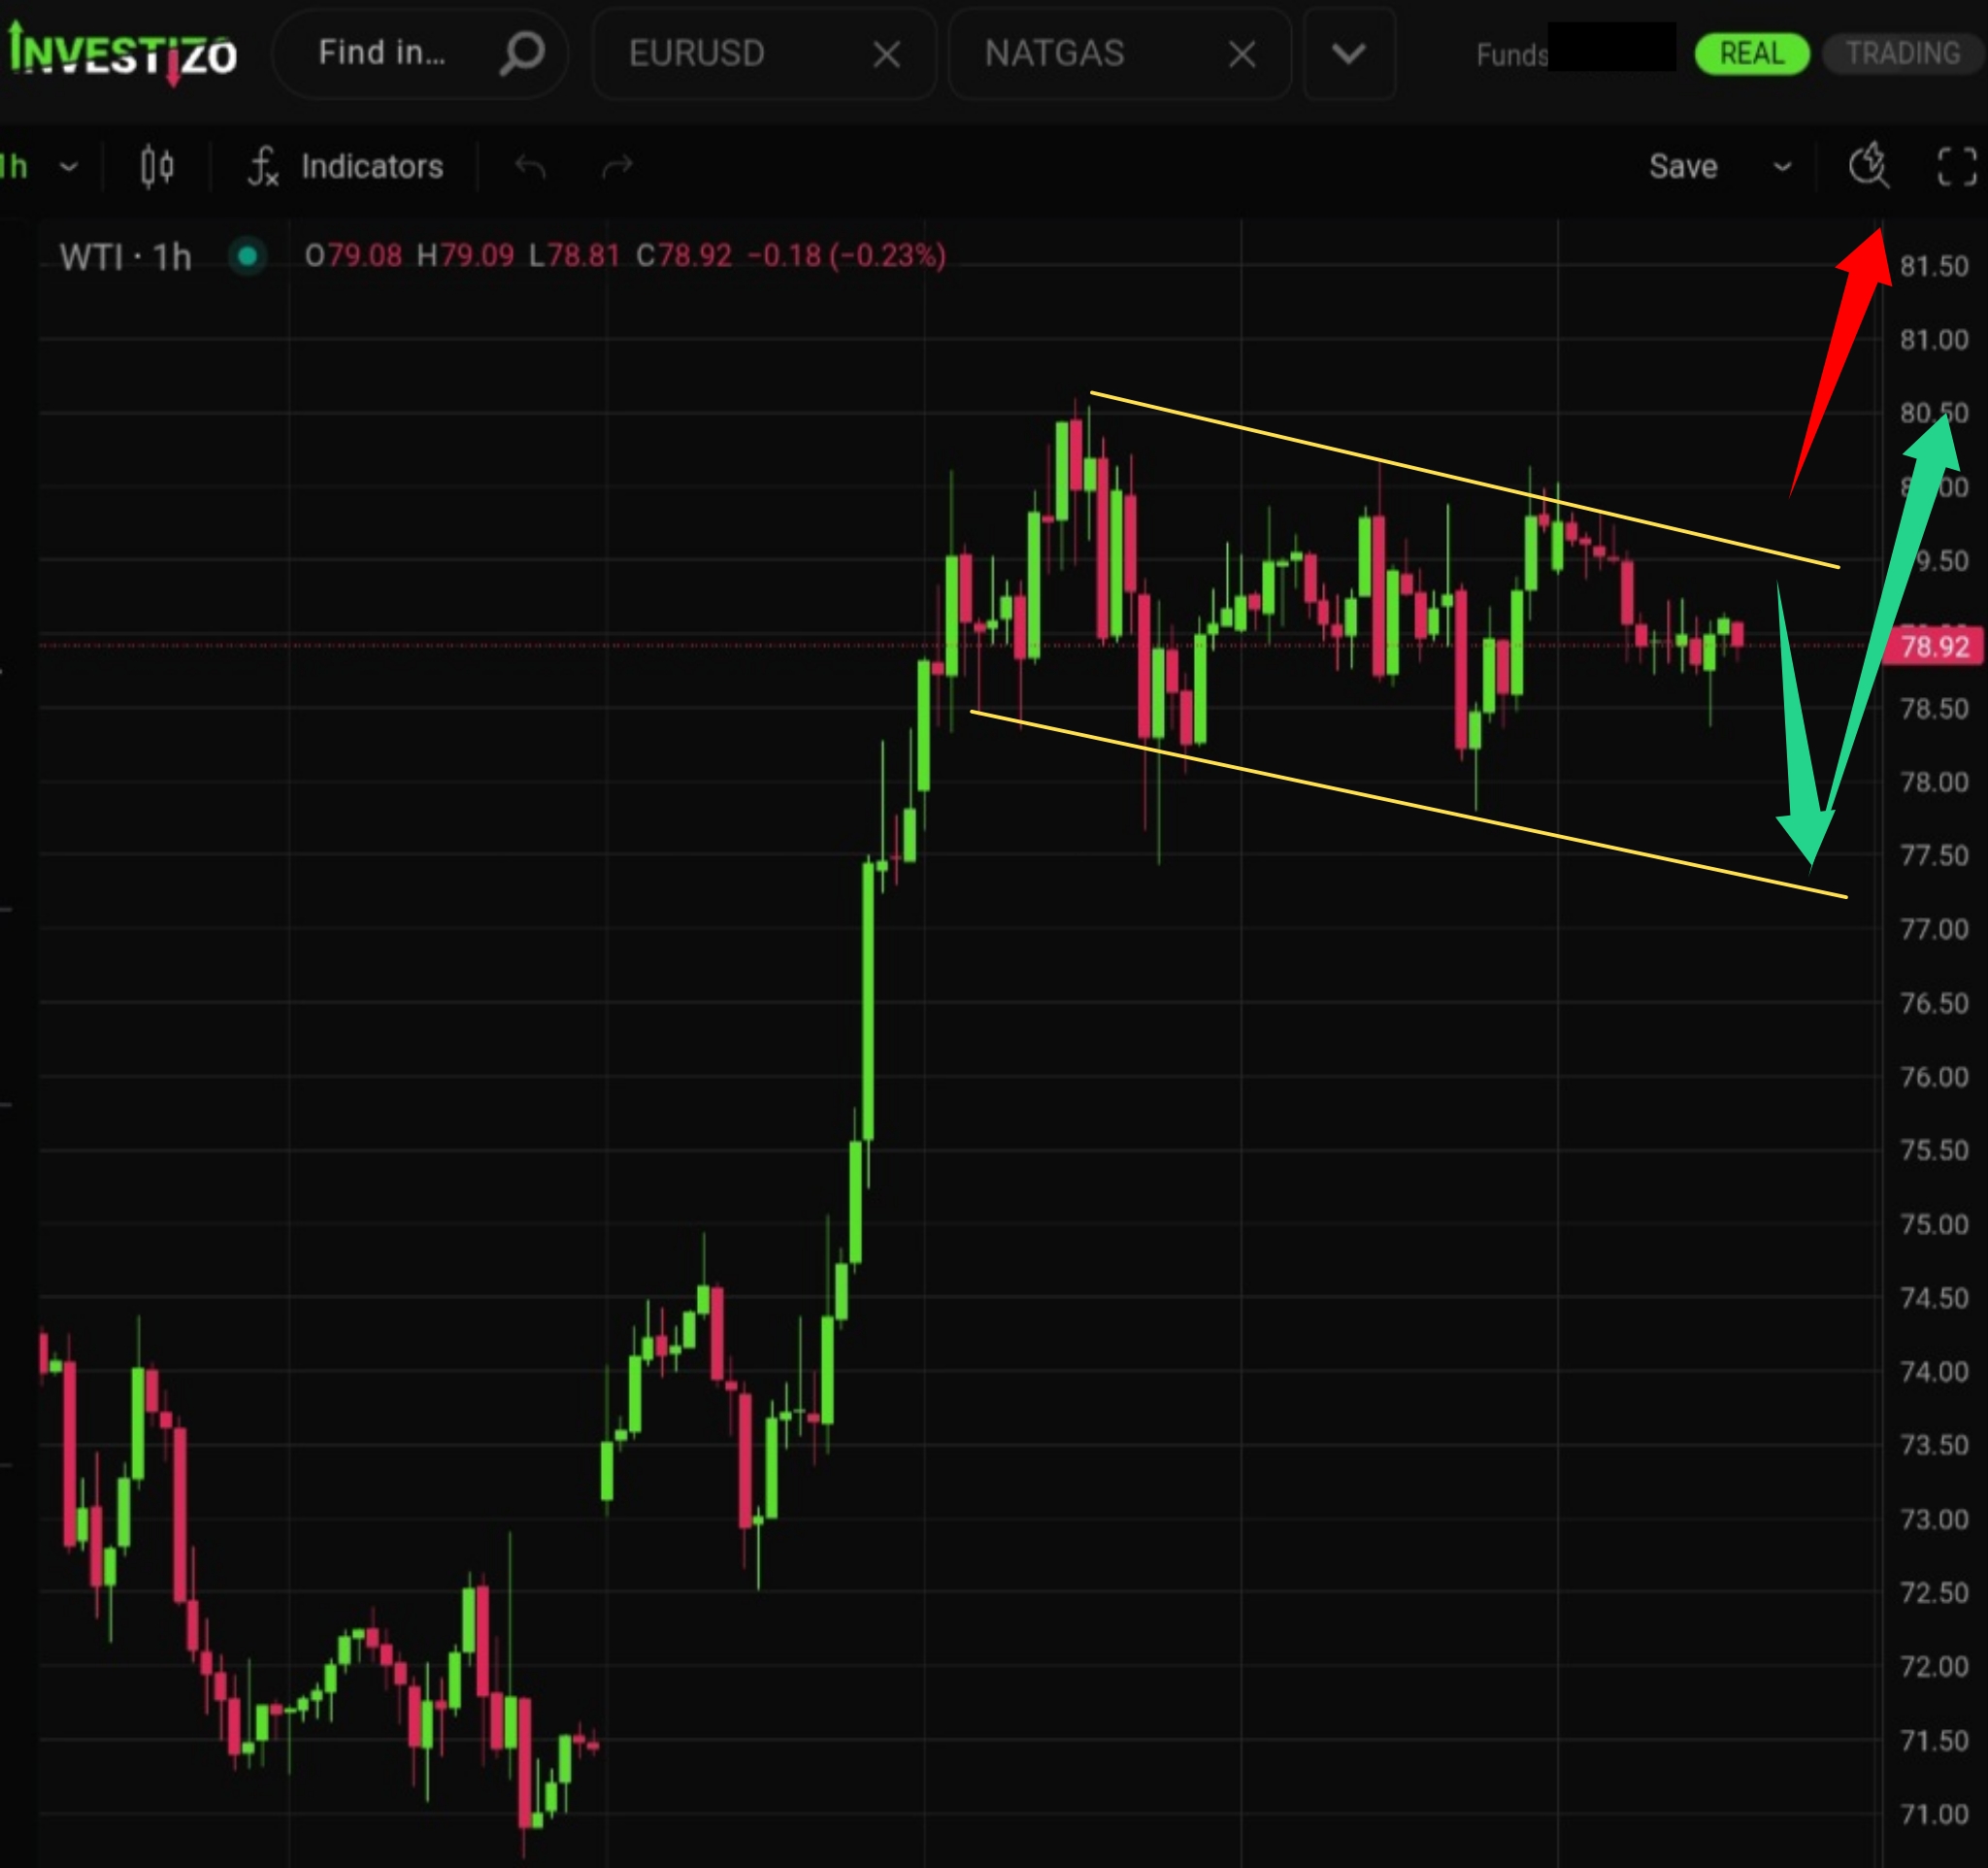
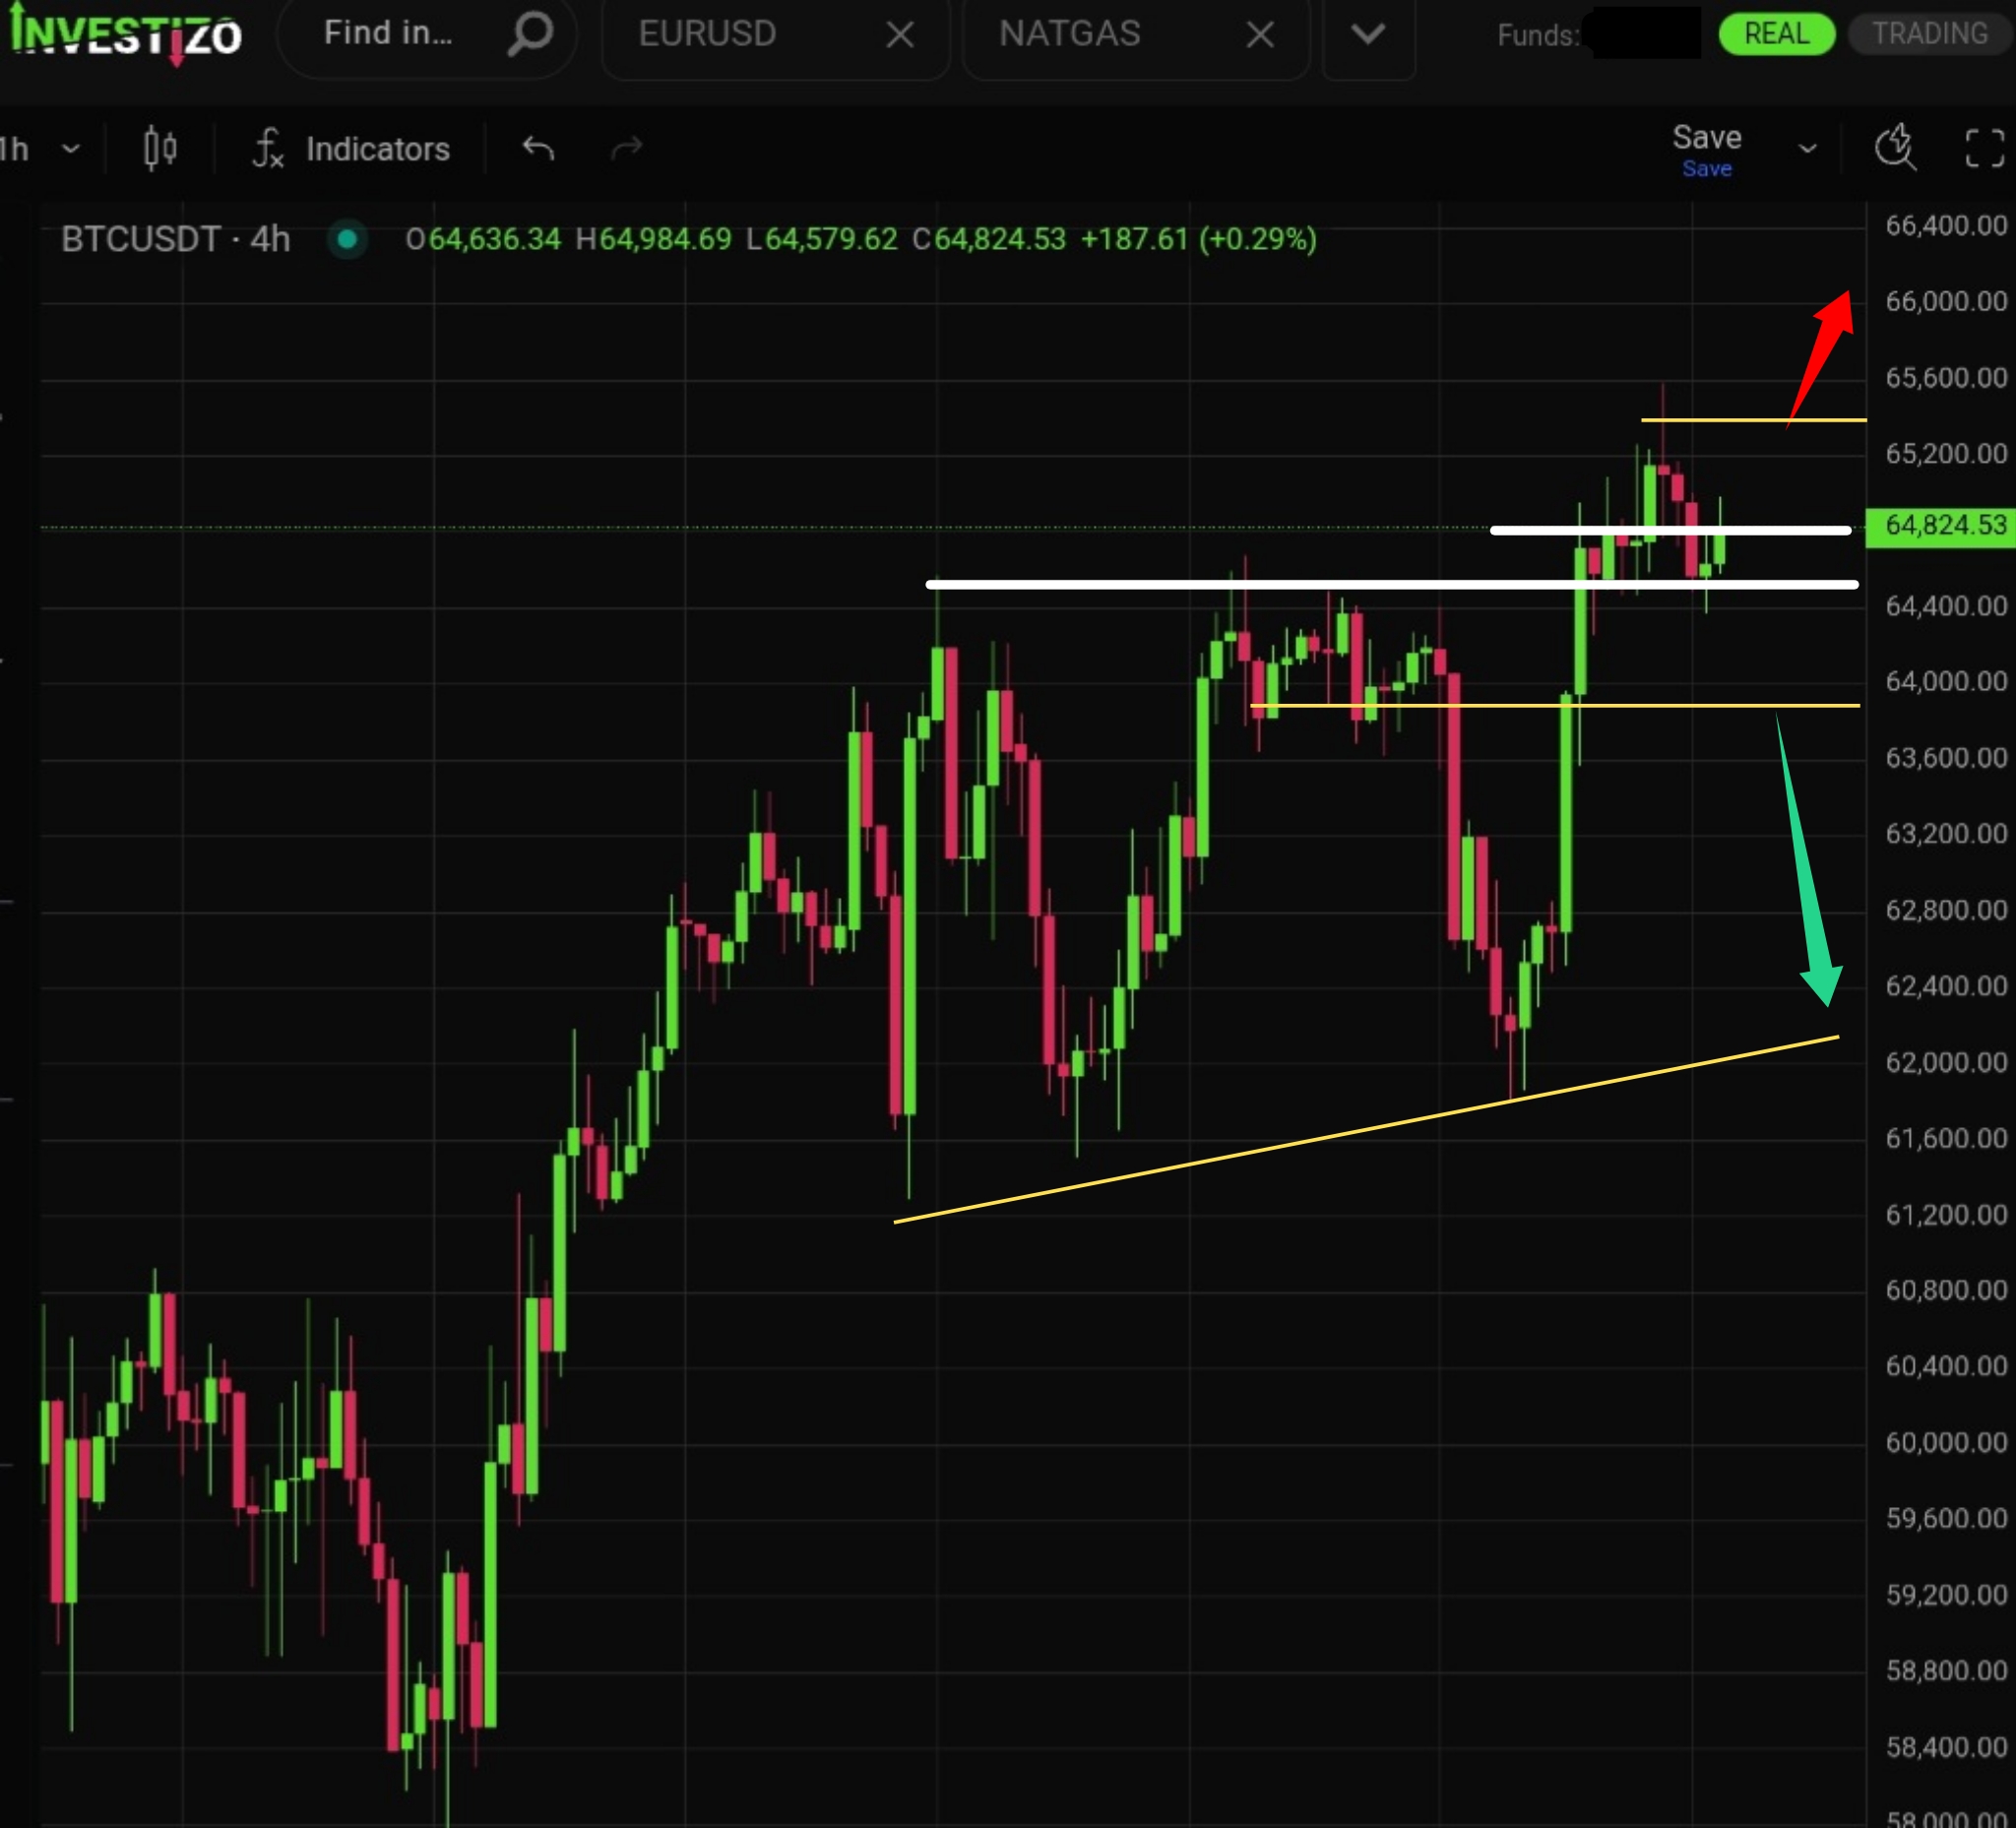
A large “bull flag” continuation pattern has formed, signaling strong potential for further upside.
The pair delivered a strong upward impulse, followed by a fairly intensive local correction.
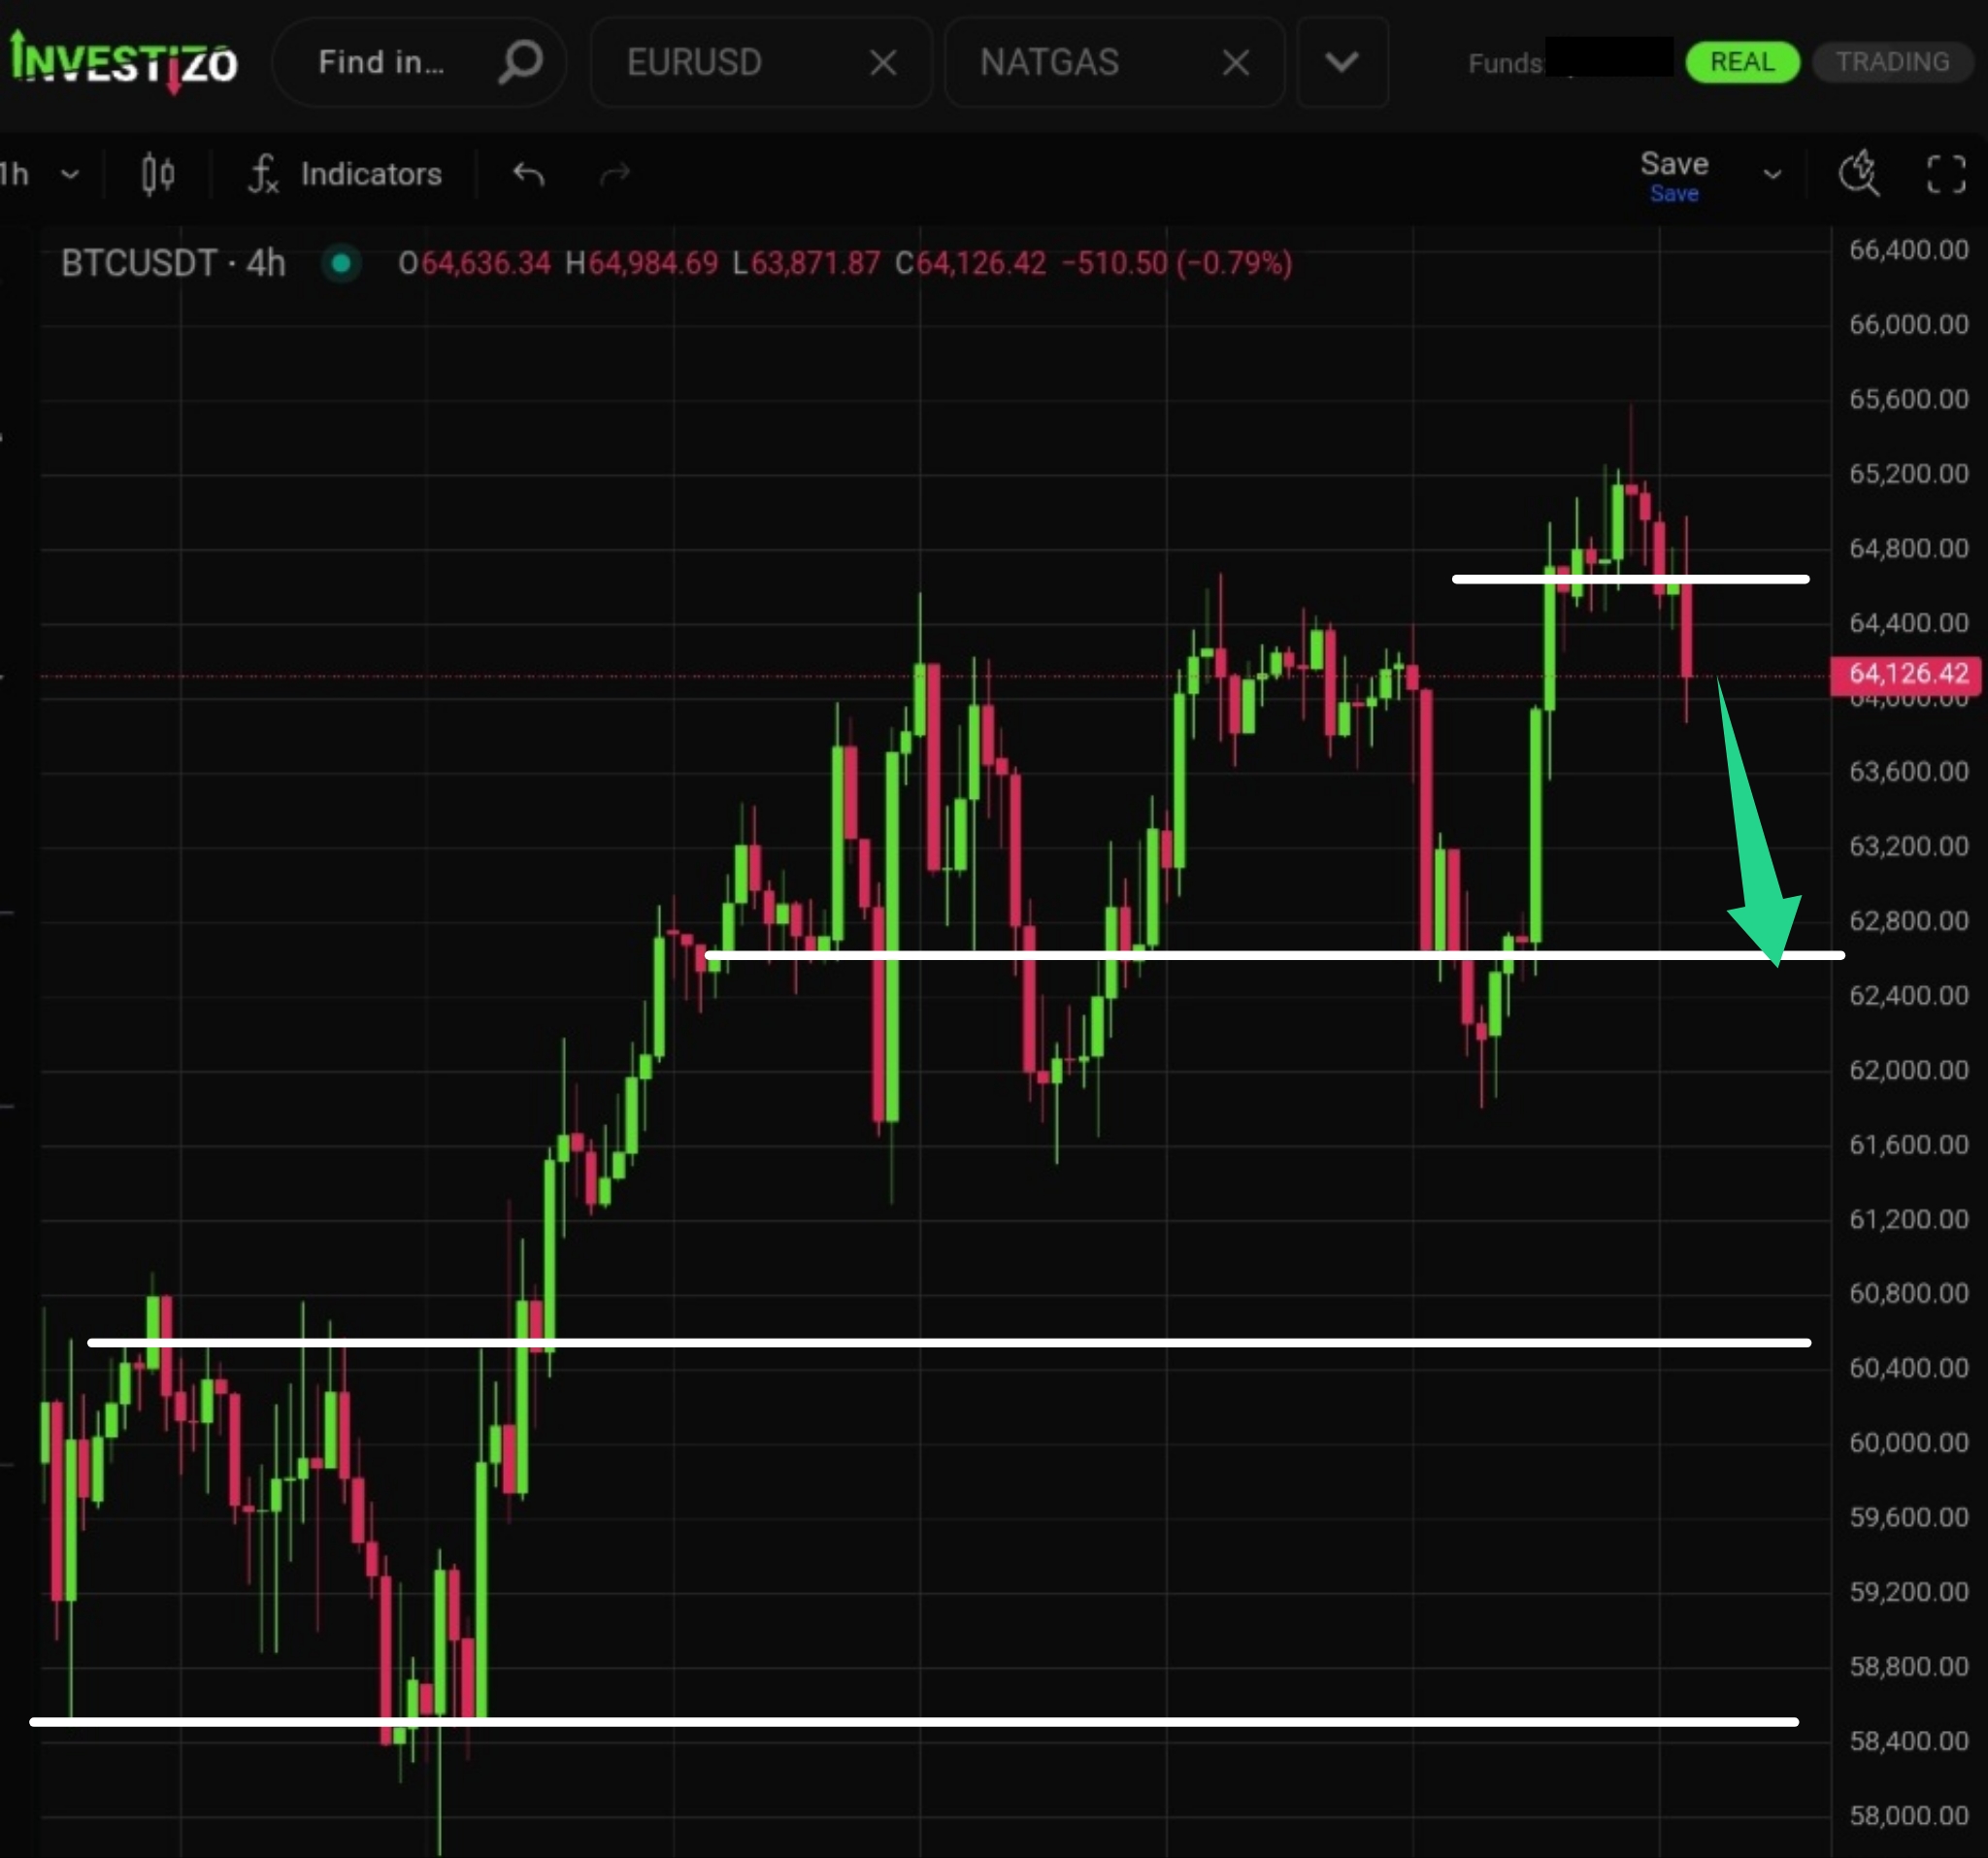
Bears predictably demonstrated strength at the first significant psychological resistance level of $65,000.
The pair is approaching a decisive moment. The triangular consolidation range is nearly filled.
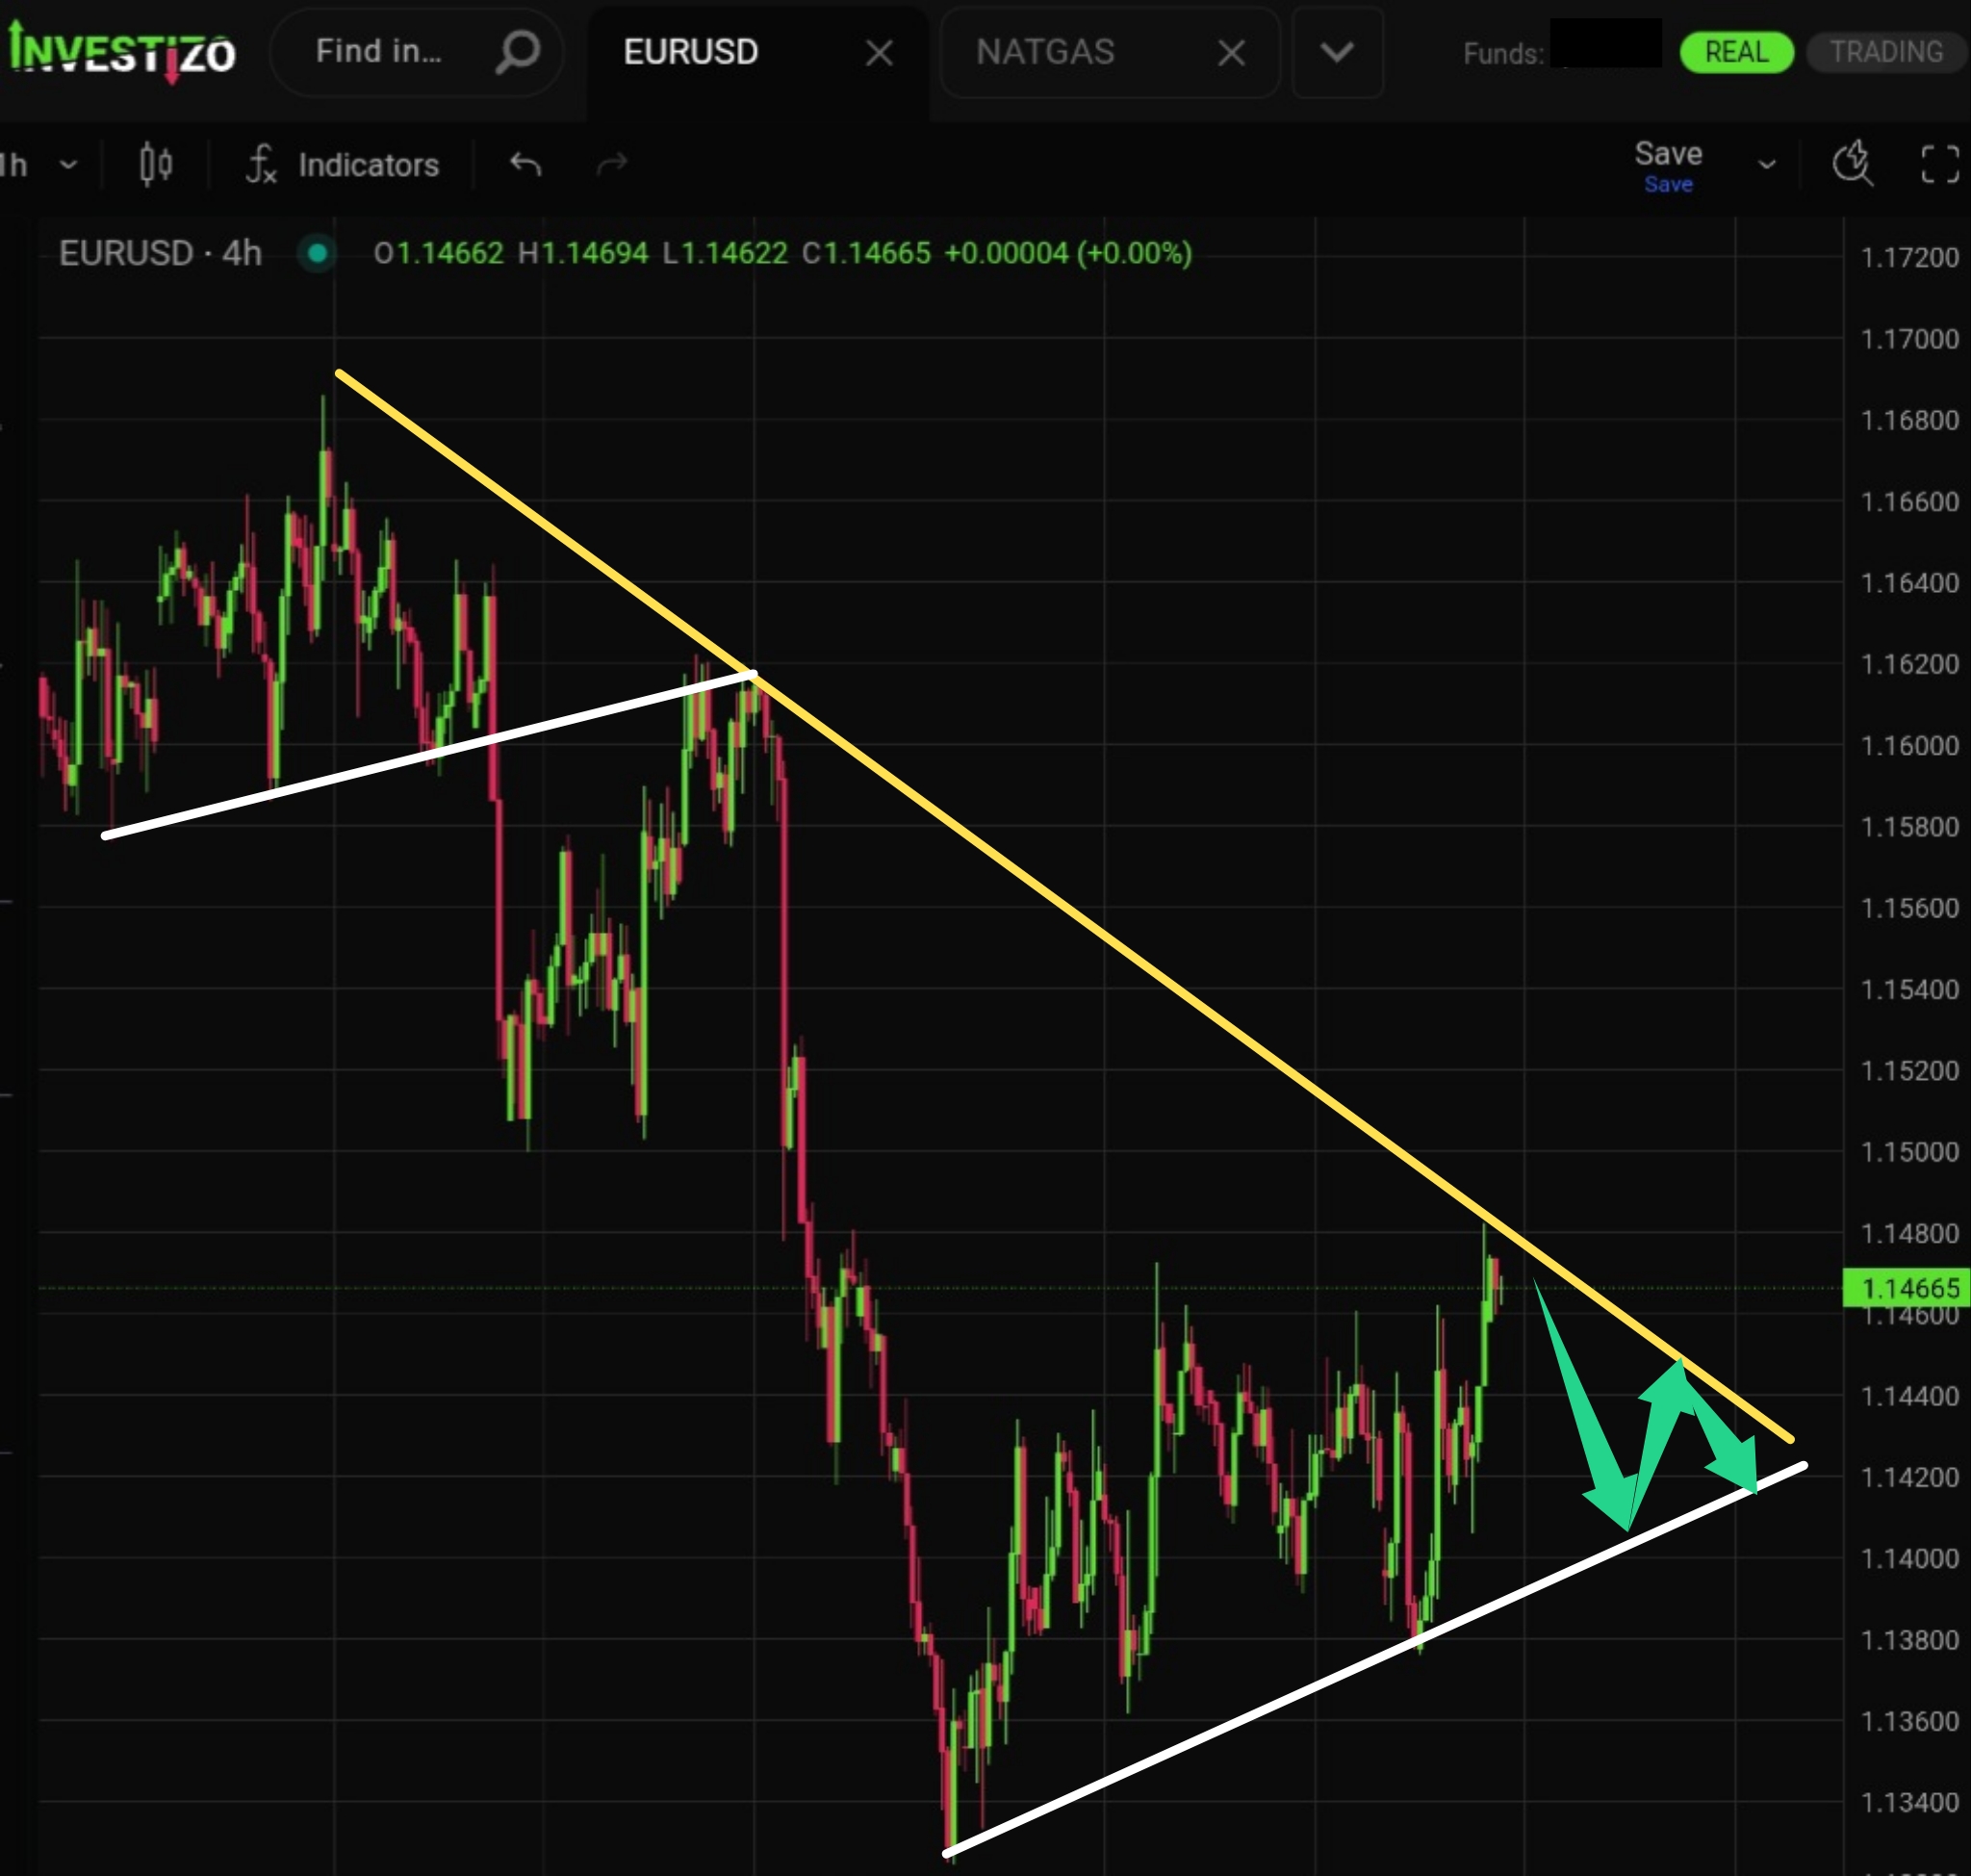
The pair is currently testing the medium-term downtrend line, which is likely to trigger a downward reversal.
Bitcoin (BTC/USD) trades at 64,825 this Thursday morning, holding its ground as the broader market weighs near-term institutional demand against long-term historical cycles.
Brent Crude trades at 83.86 this Thursday morning, pulling back slightly after spiking above 85.00 but maintaining a strong 13% gain on the week.
Bulls failed to update the upper structural high, shifting the market into either a consolidation phase.