
Bitcoin Price Forecast for Today, Tomorrow, Next Week, and 30-Day Forecast

Bitcoin price forecast for today, tomorrow, next week and 30 days: technical levels, trading plan, volatility ranges and key events.
Bitcoin trades around the clock, and traders follow it for institutional demand, spot ETF flows, regulatory news and its link with stocks. This page sets out our BTC/USD levels, scenarios and volatility ranges for the next day, the week and 30 days.
Key Takeaways
- As of 22 Nov 2026, 11:00 UTC, BTC/USD trades at $61,037 and our bias is bearish.
- Base case (1–3 days): sell at $61,037, target $55,000; a move above $62,413 invalidates it.
- Alternative: sell a rebound into $62,042, target $55,000; a move above $64,349 invalidates that setup.
- Next day (23 Nov): our base case looks for $60,000, range $57,361–64,161 (−6%, +5.1%); this week we look for $57,950, range $51,140–68,732 (−16.2%, +12.6%).
- Our 30-day level is $52,928, with a volatility range of $34,900–74,839 (−40.9%, +26.8%).
Latest Bitcoin Updates
- Nov 22, 10:35 UTC — A whale deposited 2,279 BTC ($134.7M) into Binance. — Lookonchain on X
- Nov 22, 01:55 UTC — Abraxas Capital withdrew over 17,500 BTC worth $1.04B from Binance and Kraken at an average price near $59,200. — Lookonchain on X
- Nov 22, 00:00 UTC — CleanSpark's chief business officer discussed how power access will be the key competitive advantage for Bitcoin miners going forward. — Wu Blockchain on X
- Nov 21, 21:37 UTC — Short-term Bitcoin holders began selling at a loss after price broke below the $62K–$65K range, potentially turning cost basis clusters into resistance. — Glassnode on X
- Nov 21, 20:08 UTC — The Bitcoin Fear & Greed Index has fallen to 12, indicating extreme fear. — Bitcoin Magazine on X
- Nov 21, 17:50 UTC — Bitcoin rebounded over 9% from a two-year low near $55,130 back above $60,000 on Saturday amid a broader risk-asset recovery. The prior sell-off triggered about $1.8 billion in leveraged crypto liquidations, mostly long positions. — CoinDesk
- Nov 21, 17:32 UTC — Bitcoin rebounded more than 8% to around $59,952 after dropping to a two-year low of $55,251 amid AI concerns, higher borrowing costs, stronger dollar and market volatility. — @DeItaone on X
- Nov 21, 15:25 UTC — Bitcoin climbed more than 2% to above $60,000 on Saturday after dropping below $57,742 on Friday, its lowest since September 2024. — Reuters
Bitcoin (BTC/USD) Live Price Today
Live price: $60,829.82
As of 22 Nov 2026, 11:00 UTC, Bitcoin trades at $61,037, up 0.95% from $60,463. CoinDesk reported a rebound of over 9% from near $55,130 back above $60,000 after about $1.8 billion in long liquidations. Lookonchain on X said Abraxas Capital withdrew over 17,500 BTC, worth $1.04 billion, near an average of $59,200. Cook put the 12-month PCE change at 3.8% in October (Federal Reserve, 20 Nov).

The daily candle ran from $58,759 to $61,323 and closed higher, while the D1 trend stays bearish. RSI (14) at 25.8 is deep in oversold territory, MACD is below its signal line, and EMA20 at $67,781 remains far overhead.
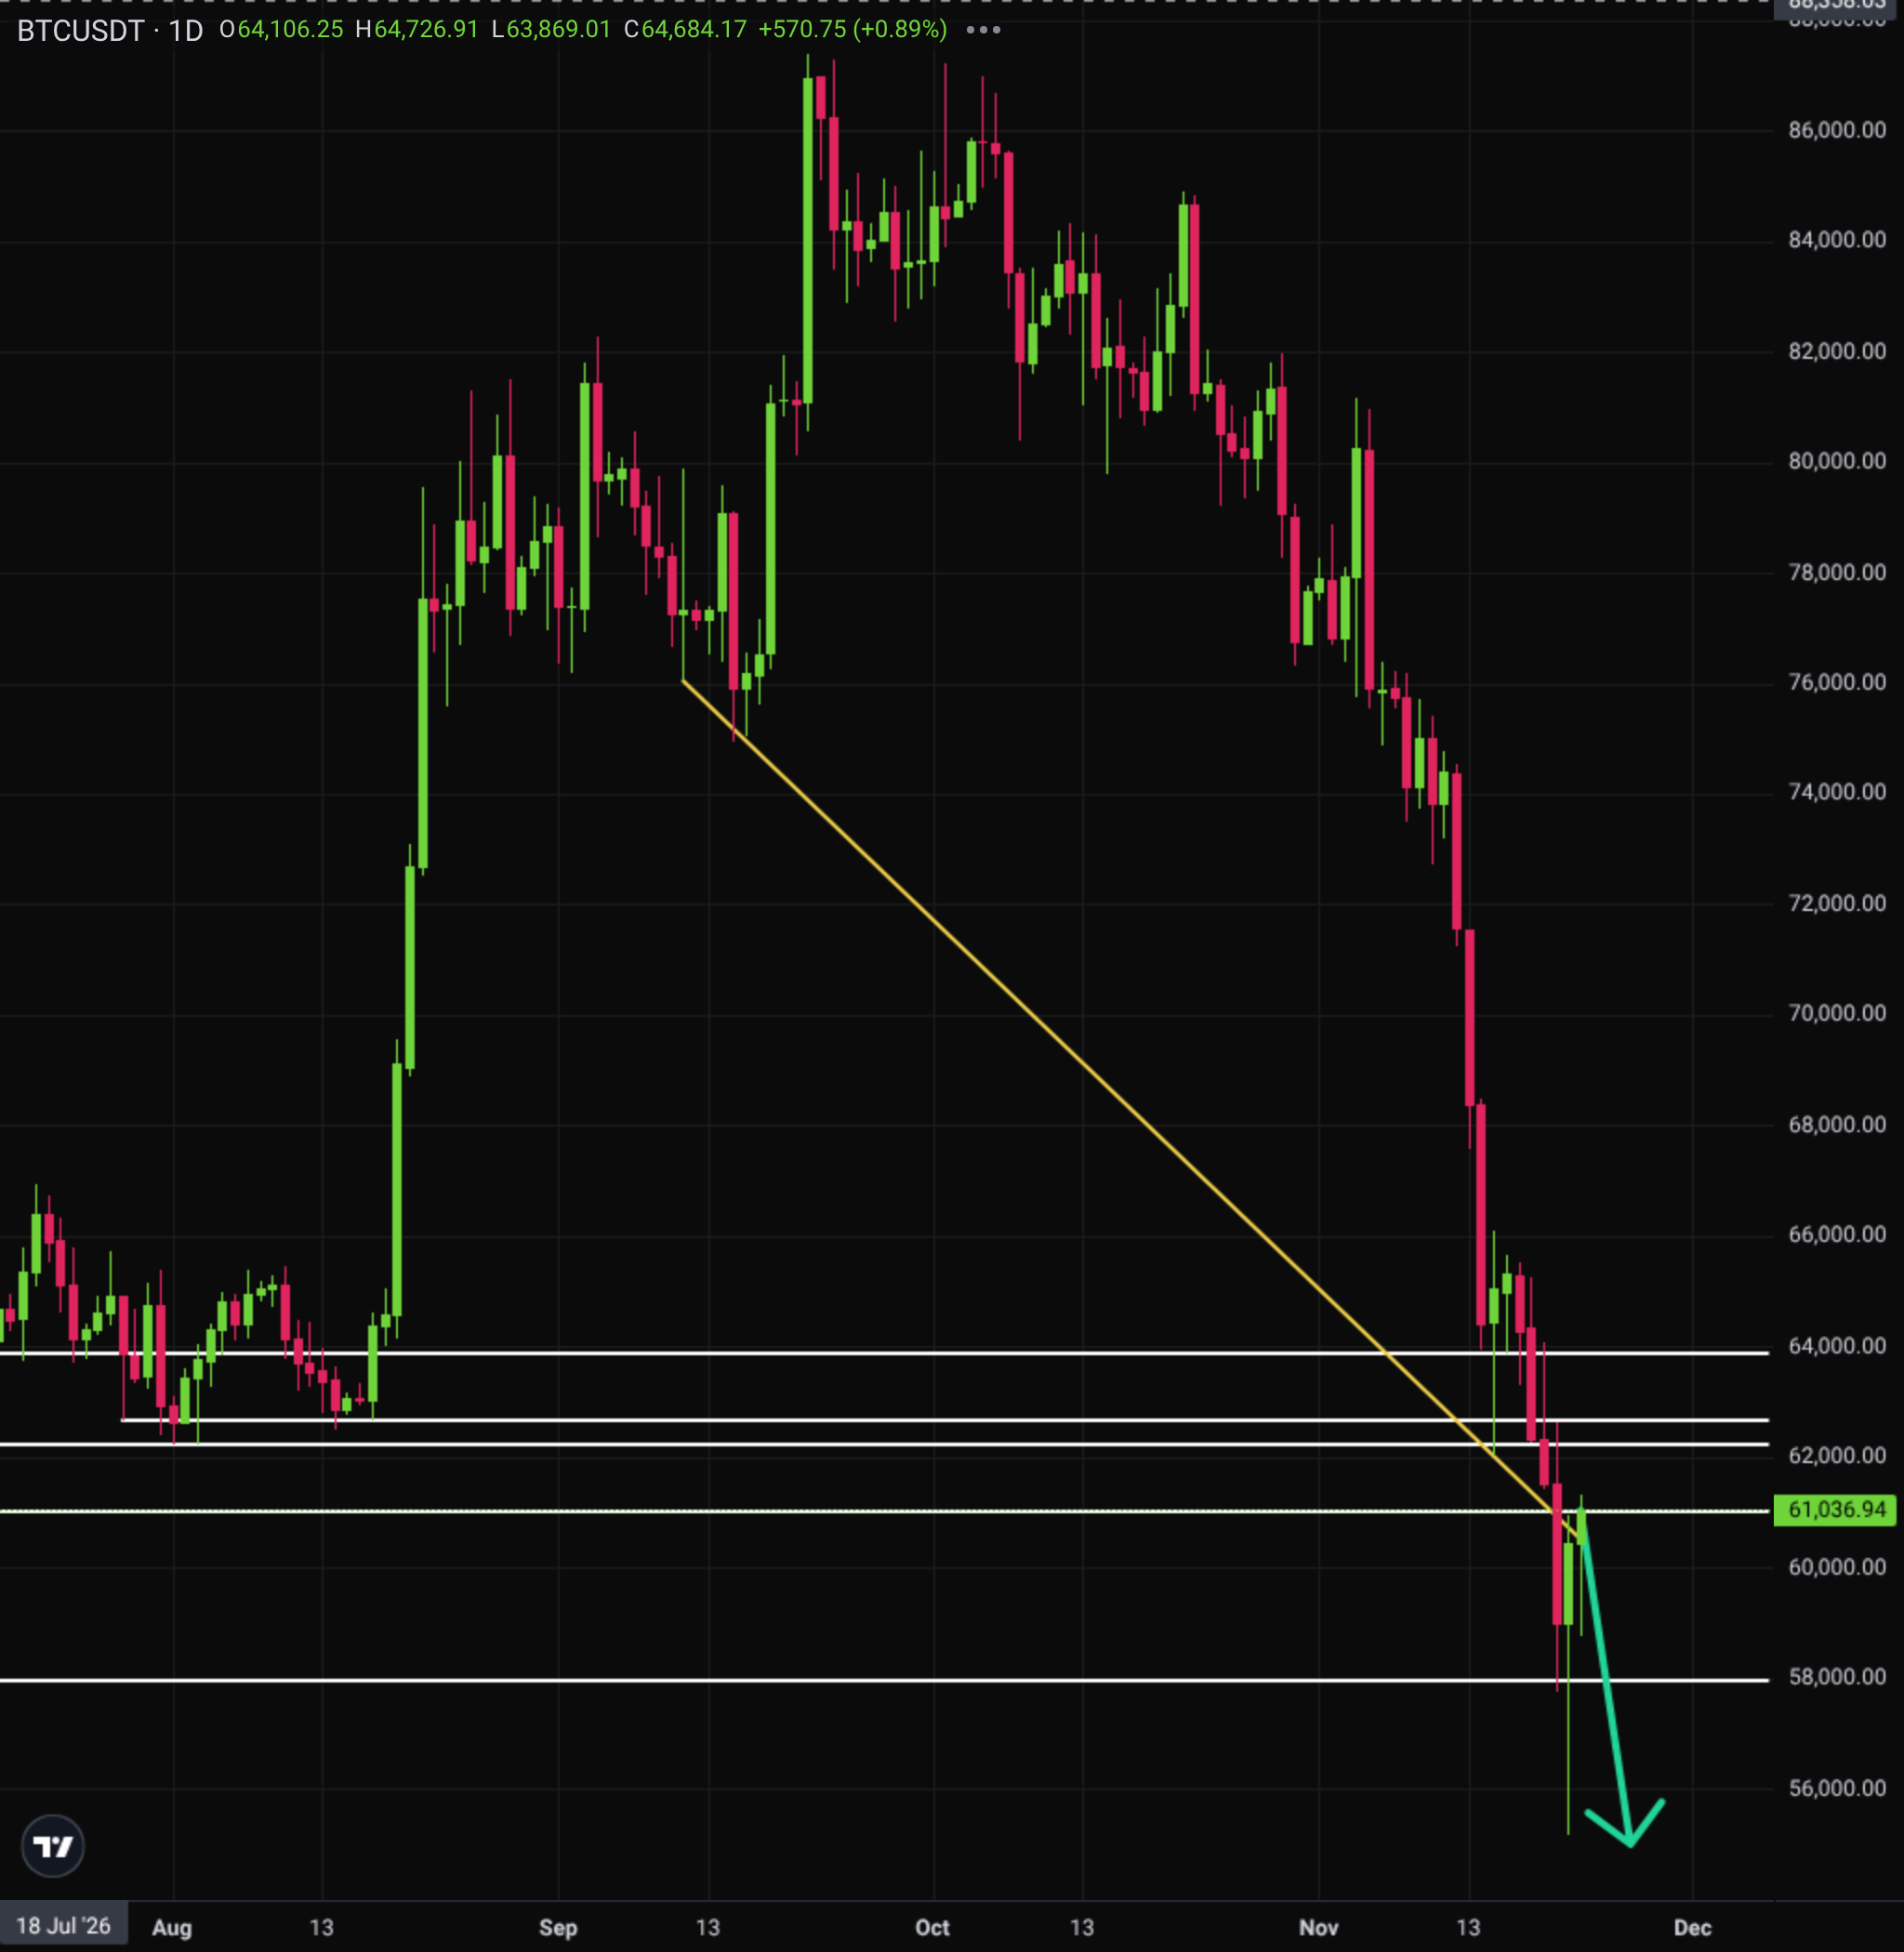
Latest Bitcoin (BTC/USD) Technical Analysis for Today
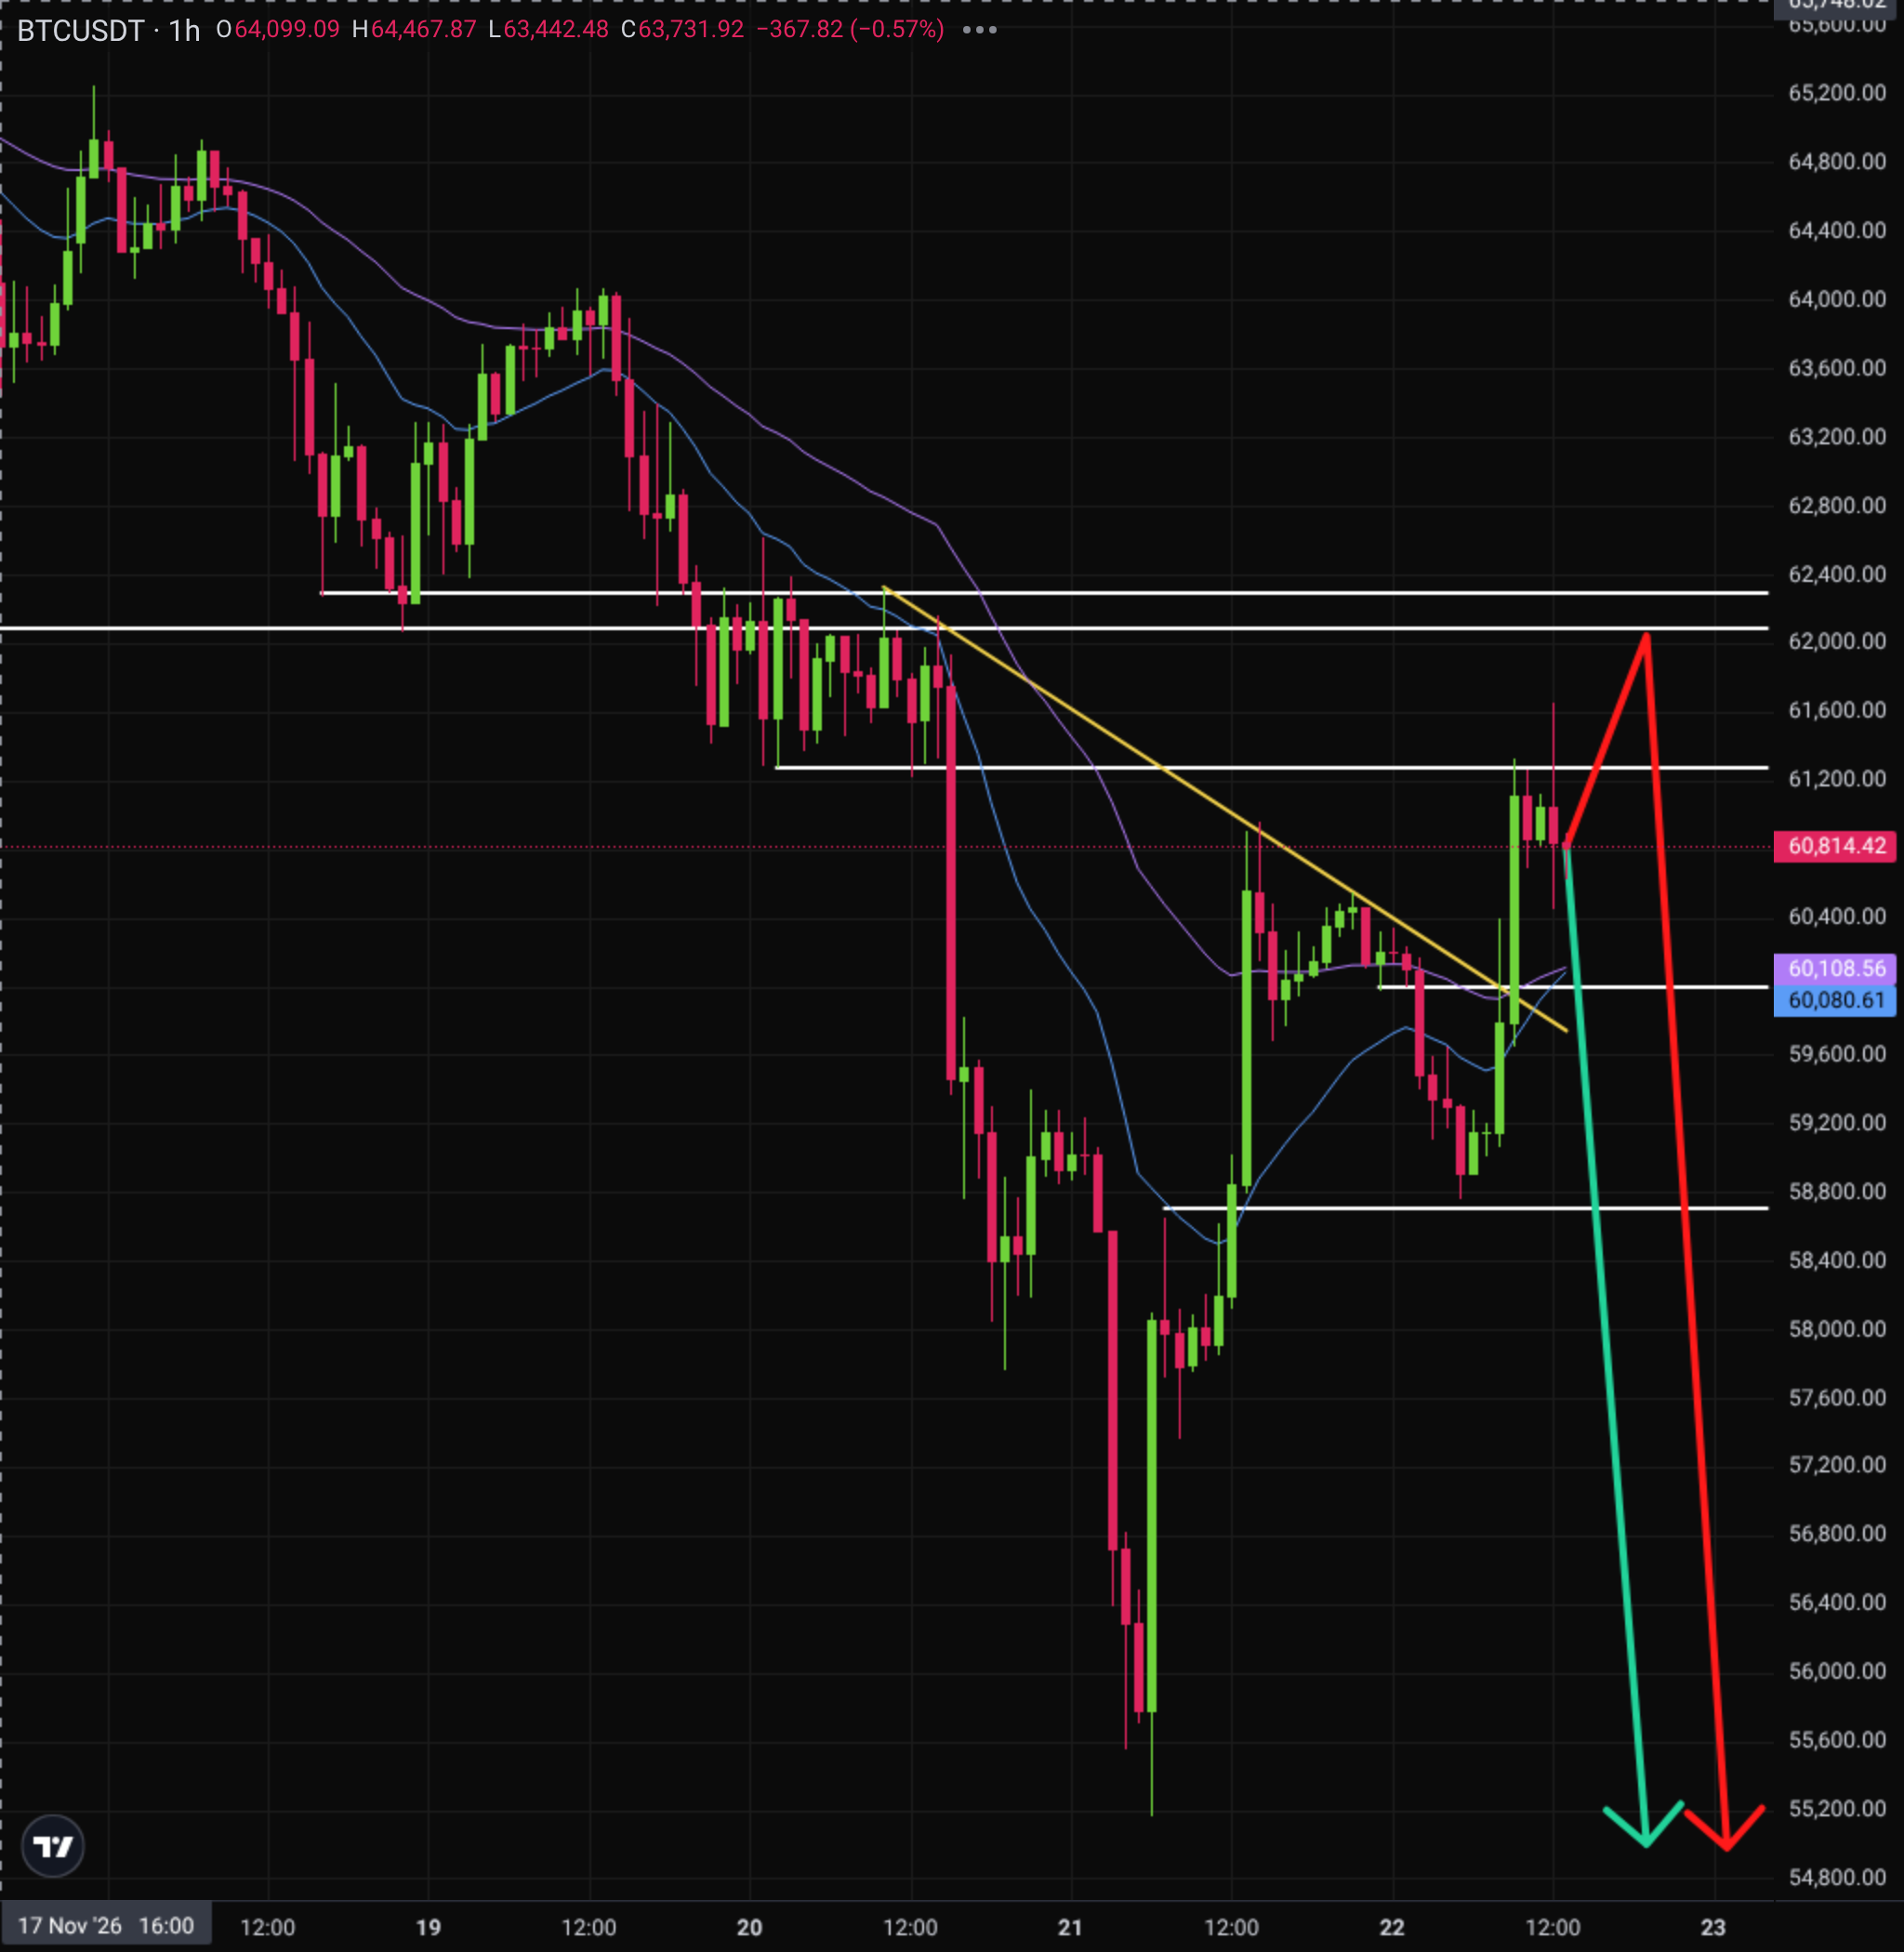
Bitcoin’s H1 trend is neutral as of 22 Nov, 12:00 UTC, with price at $60,676.14. Support at $60,000 is holding, and the next resistance is $61,271. RSI (14) is at 58.4, and MACD is above its signal line.
RSI (14): 58.4 · MACD: above signal · EMA20: $59,988 · EMA50: $60,073 · ATR (14): $688
BTC/USD stays bearish on the H4 chart, with resistance at $62,042 and support at $55,000. Sellers pressed the rebound, and price at $61,037 has not cleared that resistance. RSI (14) at 48.8 is mid-range after the descending trendline gave way near $59,792.
RSI (14): 48.8 · MACD: above signal · EMA20: $60,757 · EMA50: $63,371 · ATR (14): $1,484
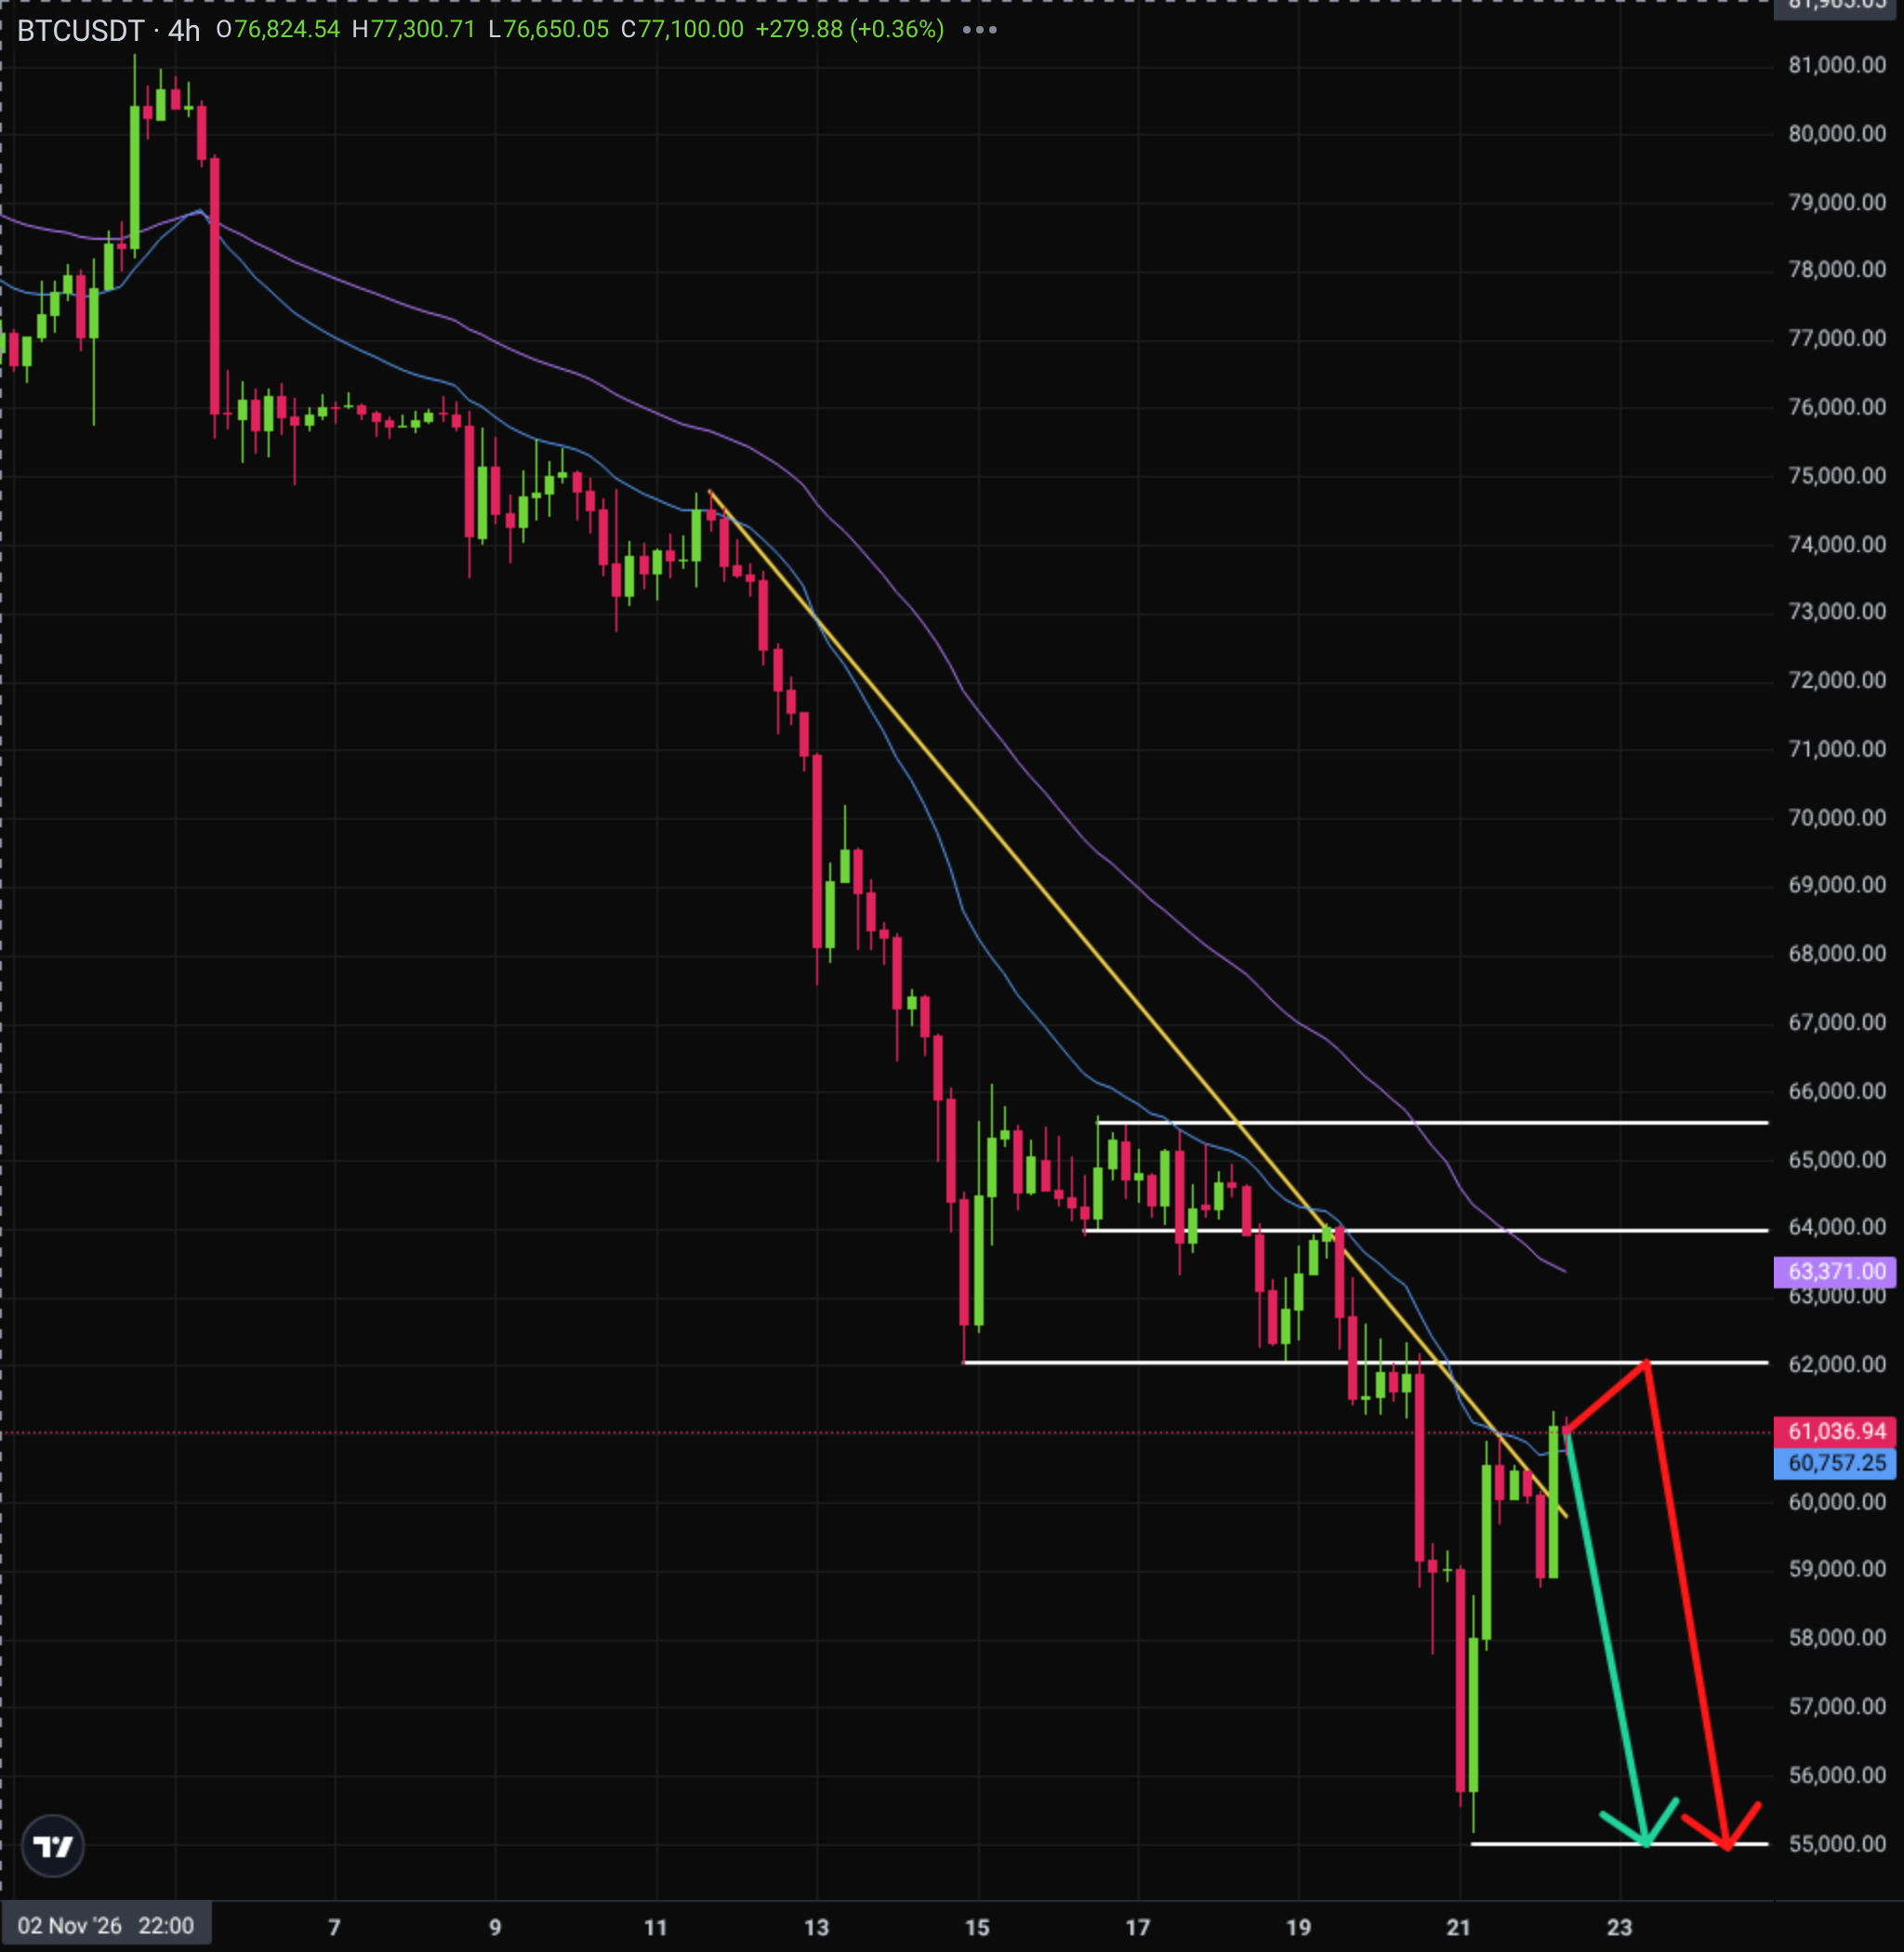
Key Bitcoin Support and Resistance Levels
Bitcoin (BTC/USD) Trading Plan for Today
Base case (1–3 days): sell at market from $61,037, target $55,000. A break above $62,413 invalidates that plan and flips the bias. Alternative: sell a rebound into $62,042, target $55,000; a move above $64,349 ends that setup.
Event risk: Bitcoin rebounded over 9% from a two-year low near $55,130 back above $60,000 on Saturday amid a broader risk-asset recovery. The prior sell-off triggered about $1.8 billion in leveraged crypto liquidations, mostly long positions (CoinDesk, Nov 21, 17:50 UTC). Moves on news can break key levels without a technical signal.
Bitcoin (BTC/USD) Price Forecast for Tomorrow
Our base case for Bitcoin's price tomorrow looks for a move toward $60,000. Our volatility range for 23 Nov is $57,361–64,161 (−6%, +5.1%). That lean holds unless price breaks above $62,413.
A volatility range, not a price target, measured from $61,037, the price at 11:00 UTC on 22 Nov 2026. In the past, moves over the same span stayed inside both bounds 80% of the time.
Bitcoin (BTC/USD) Price Forecast for This Week
Our base case for this week looks for a move toward $57,950. The week runs to 29 Nov, so the path can extend past the next-day level. Our volatility range is $51,140–68,732 (−16.2%, +12.6%). Lookonchain on X reported that Abraxas Capital withdrew over 17,500 BTC, which could slow a fresh leg lower if those coins stay off exchanges.
A volatility range, not a price target, measured from $61,037, the price at 11:00 UTC on 22 Nov 2026. In the past, moves over the same span stayed inside both bounds 80% of the time.
Upcoming Economic Events
Key USD events from the Investizo economic calendar; it lists events through 3 Dec 2026 so far.
Bitcoin (BTC/USD) Price Forecast for the Next 30 Days
Our base case for the next 30 days looks for a move toward $52,928 while Bitcoin holds below $60,000. Our volatility range from 21 Nov to 20 Dec runs from $34,900 to $74,839 (−40.9%, +26.8%). Reuters reported on 20 Nov that the slide below $60,000 came as valuation concerns hit other risk assets. A break above $60,000 would set that base case aside and open $65,000. The BEA publishes its second GDP estimate and core PCE on 25 Nov, and the ISM Manufacturing PMI follows on 1 Dec.
A volatility range, not a price target, measured from $59,004, the price at 17:00 UTC on 20 Nov 2026. In the past, moves over the same span stayed inside both bounds 80% of the time.
How the ranges are built: the 90th percentile of historical moves over the same number of days in the last 17 months of daily data, in ATR (14, D1) units, scaled by the current ATR. Their width reflects past moves, not our view. Our level for each period is the one closest to how far a typical past move of that length went in the direction of our bias: it scales our view to the period and is not a calibrated forecast.
The weekly chart is bearish: RSI (14) is at 32.9 and MACD is below its signal line. Resistance sits at $60,000, with support at $57,166 and $52,928.
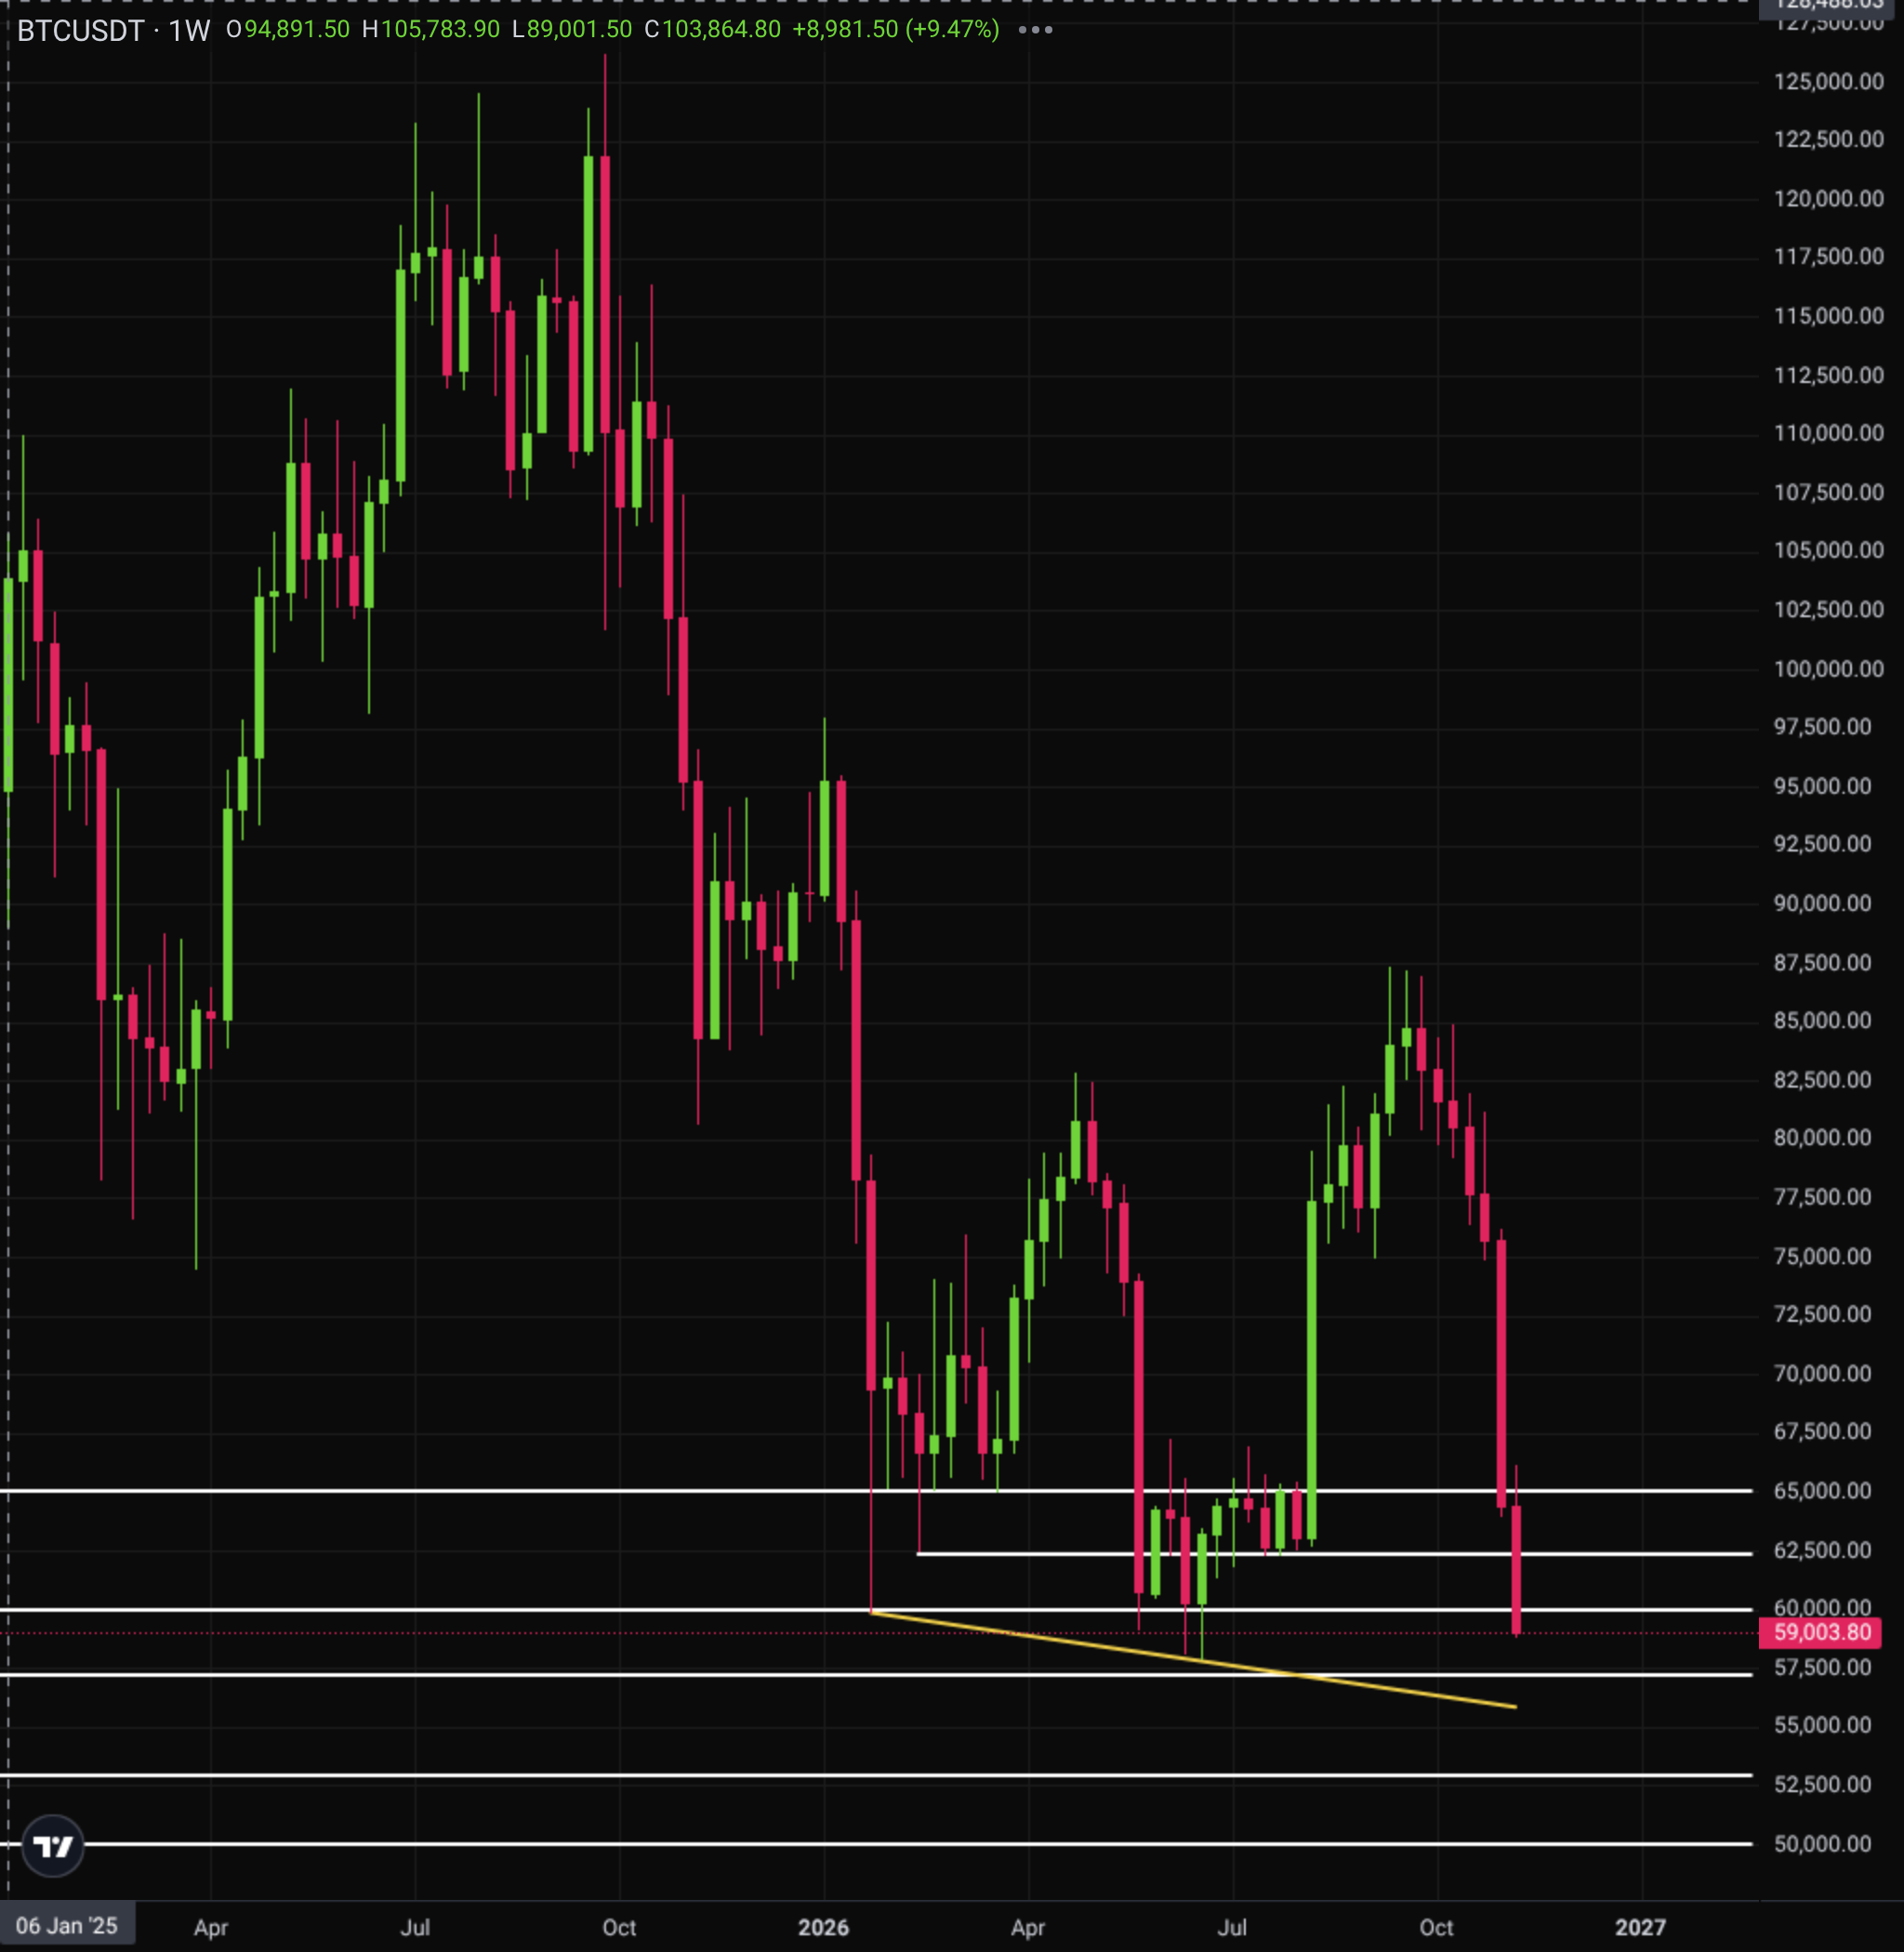
30-Day Scenarios
- Our base case looks for a move toward $52,928 while Bitcoin stays below $60,000.
- A break above $60,000 would open a rebound toward $65,000.
- A break below $52,928 would open a further slide toward $50,000.
Forecast Track Record
Over the last 14 days (10 forecasts), the next-day range held on 7 of 10 days; the base case reached its target 2 times and was stopped out 2 times, 3 expired without either and 3 were not triggered. Every forecast on this page is recorded and checked against actual prices, misses included.
Is Bitcoin a Good Investment?
Traders follow Bitcoin because it trades around the clock and can move far in a short time. Investors watch it for a different reason: demand from large buyers, spot ETF flows and rule changes can shift the price for months. It often moves with the stock market, so a risk-off week in shares can pull Bitcoin lower too. Sharp swings, changing rules and long drawdowns are lasting risks you should weigh before you commit capital.
You can trade BTC/USD with Investizo: open an account.
Summary
The bias stays bearish while Bitcoin holds below $62,413. Our base case still looks for lower prices into the week. Core PCE on 25 Nov (BEA) is the data point that could shift that view.
Bitcoin Price Analysis and Forecasting Methodology
Our Bitcoin forecast methodology combines technical analysis, fundamentals and news sentiment. Prices are Investizo MT4 quotes. Indicators: EMA20 and EMA50, RSI (14), MACD (12, 26, 9) and ATR (14), on H1, H4, D1 and weekly bars. Support and resistance come from swing highs and lows (clustered within a quarter of ATR) and round psychological numbers; trendlines connect swing points. The bias follows the H4 and daily trends (price and EMA20 against EMA50). Entries sit at a level, on a retest or on a break of a level; the stop is the level that invalidates the setup, and the target is the next level with at least 1.5 times the risk. Ranges for the next day, week and 30 days are volatility-based, as described under the 30-day table. Fundamentals come from the Investizo economic calendar and primary releases of central banks and statistics agencies. An hourly digest of news sites and selected X accounts adds news sentiment: it explains moves and risks but never sets levels.
Sources
- Federal Reserve, 20 Nov 2026: Governor Lisa Cook estimated that the 12-month change in the PCE price index was 3.8 percent in October.
- Federal Reserve, 18 Nov 2026: Federal Reserve staff estimated that the 12-month PCE price inflation rose to 3.6 percent in September.
- Federal Reserve, 18 Nov 2026: The Desk survey median estimate of the longer-run nominal federal funds rate increased to about 3.4 percent.
- Federal Reserve, 20 Nov 2026: The unemployment rate was 4.1 percent in October.
- Federal Reserve, 20 Nov 2026: Payrolls climbed by 165,000 in October.
- U.S. Treasury, 18 Nov 2026: The net TIC inflow in September was $261.0 billion.
The trade levels, signals and forecasts in this article are calculated automatically from technical indicators and price history. They are not investment advice or a recommendation to buy or sell any financial instrument. Past performance and forecasts do not guarantee future results. Risk Warning: CFDs are complex financial products traded on margin. Trading CFDs is risky and may not be suitable for all investors. Ensure you understand the risks involved as you may lose all your invested capital.
Bitcoin (BTC/USD) Price Forecast FAQs
What is the current price of Bitcoin (BTC/USD) now?
As of November 22, 2026, Bitcoin (BTC/USD) trades at $60,829.82. Our levels and ranges on this page are as of 22 Nov 2026, 11:00 UTC.
Will Bitcoin Go Up Tomorrow?
Our base case does not look for a rise. We expect a move toward $60,000, inside $57,361–64,161 (−6%, +5.1%). A break above $62,413 would change that view.
Will Bitcoin Rise or Fall Next Week?
Our base case looks for a fall toward $57,950 this week. The volatility range is $51,140–68,732 (−16.2%, +12.6%). A move above $62,413 would change the bearish lean.
What Could Trigger a Short-Term Drop in Bitcoin (BTC/USD)?
A failed hold of $60,000 could open a fresh leg lower toward $55,000. That is our one-to-three-day base case. Hotter Core PCE on 25 Nov could add selling pressure.
How Do We Do Bitcoin Technical Analysis?
We read the H1, H4, daily and weekly charts with EMA20 and EMA50, RSI (14), MACD and ATR (14). Support and resistance come from swing highs and lows and round numbers, and the bias follows the H4 and daily trends.
How to Trade Bitcoin Technical Analysis?
Use the levels as reference points: wait for the entry trigger, set the stop where the setup is invalidated and size the position so a stop-out stays within your risk limit. Our plans are analysis, not advice.
Khaled Kamal is a Market Analyst & Business Development Manager at Investizo with several years of experience in the financial services industry. His areas of focus include forex markets, trading strategies, risk management, copy trading and the practical aspects of financial markets.
Award history
More about awards
2023—2026 - 10 awards achieved