
Gold Price Forecast for Today, Tomorrow, Next Week, and 30-Day Forecast

Gold price forecast and analysis for today, tomorrow, next week and the next 30 days, including key technical levels and market drivers.
Gold is one of the most actively traded financial instruments because of its high liquidity and sensitivity to interest rates, the US dollar, inflation, and global risk. XAU/USD analysis helps traders assess the current market direction, key support and resistance levels, and potential price scenarios.
Key Takeaways
Intraday: Prefer buy setups on a retest of the $4,140 demand zone with stops below $4,130.
Base scenario: Pullback to $4,140 followed by a reversal higher toward $4,180.
Alternative scenario: Direct advance toward $4,170–$4,180 from current levels.
This week: Range-bound near the $4,140–$4,160 pivot; U.S. data and yields will decide direction.
30-day outlook: Consolidation between $4,150–$4,200 is the most likely path, with upside potential to $4,240 if safe-haven demand returns.
Latest Gold (XAU/USD) Technical Analysis for Today
Gold price today shows bulls displaying clear strength, even though the broader structure remains bearish for now. A decisive break above $4,170 is required to flip the structure. Such a move becomes more likely after a retest of the $4,130–$4,140 zone.
RSI: 60,29
MACD: Bullish
MA: 4,189
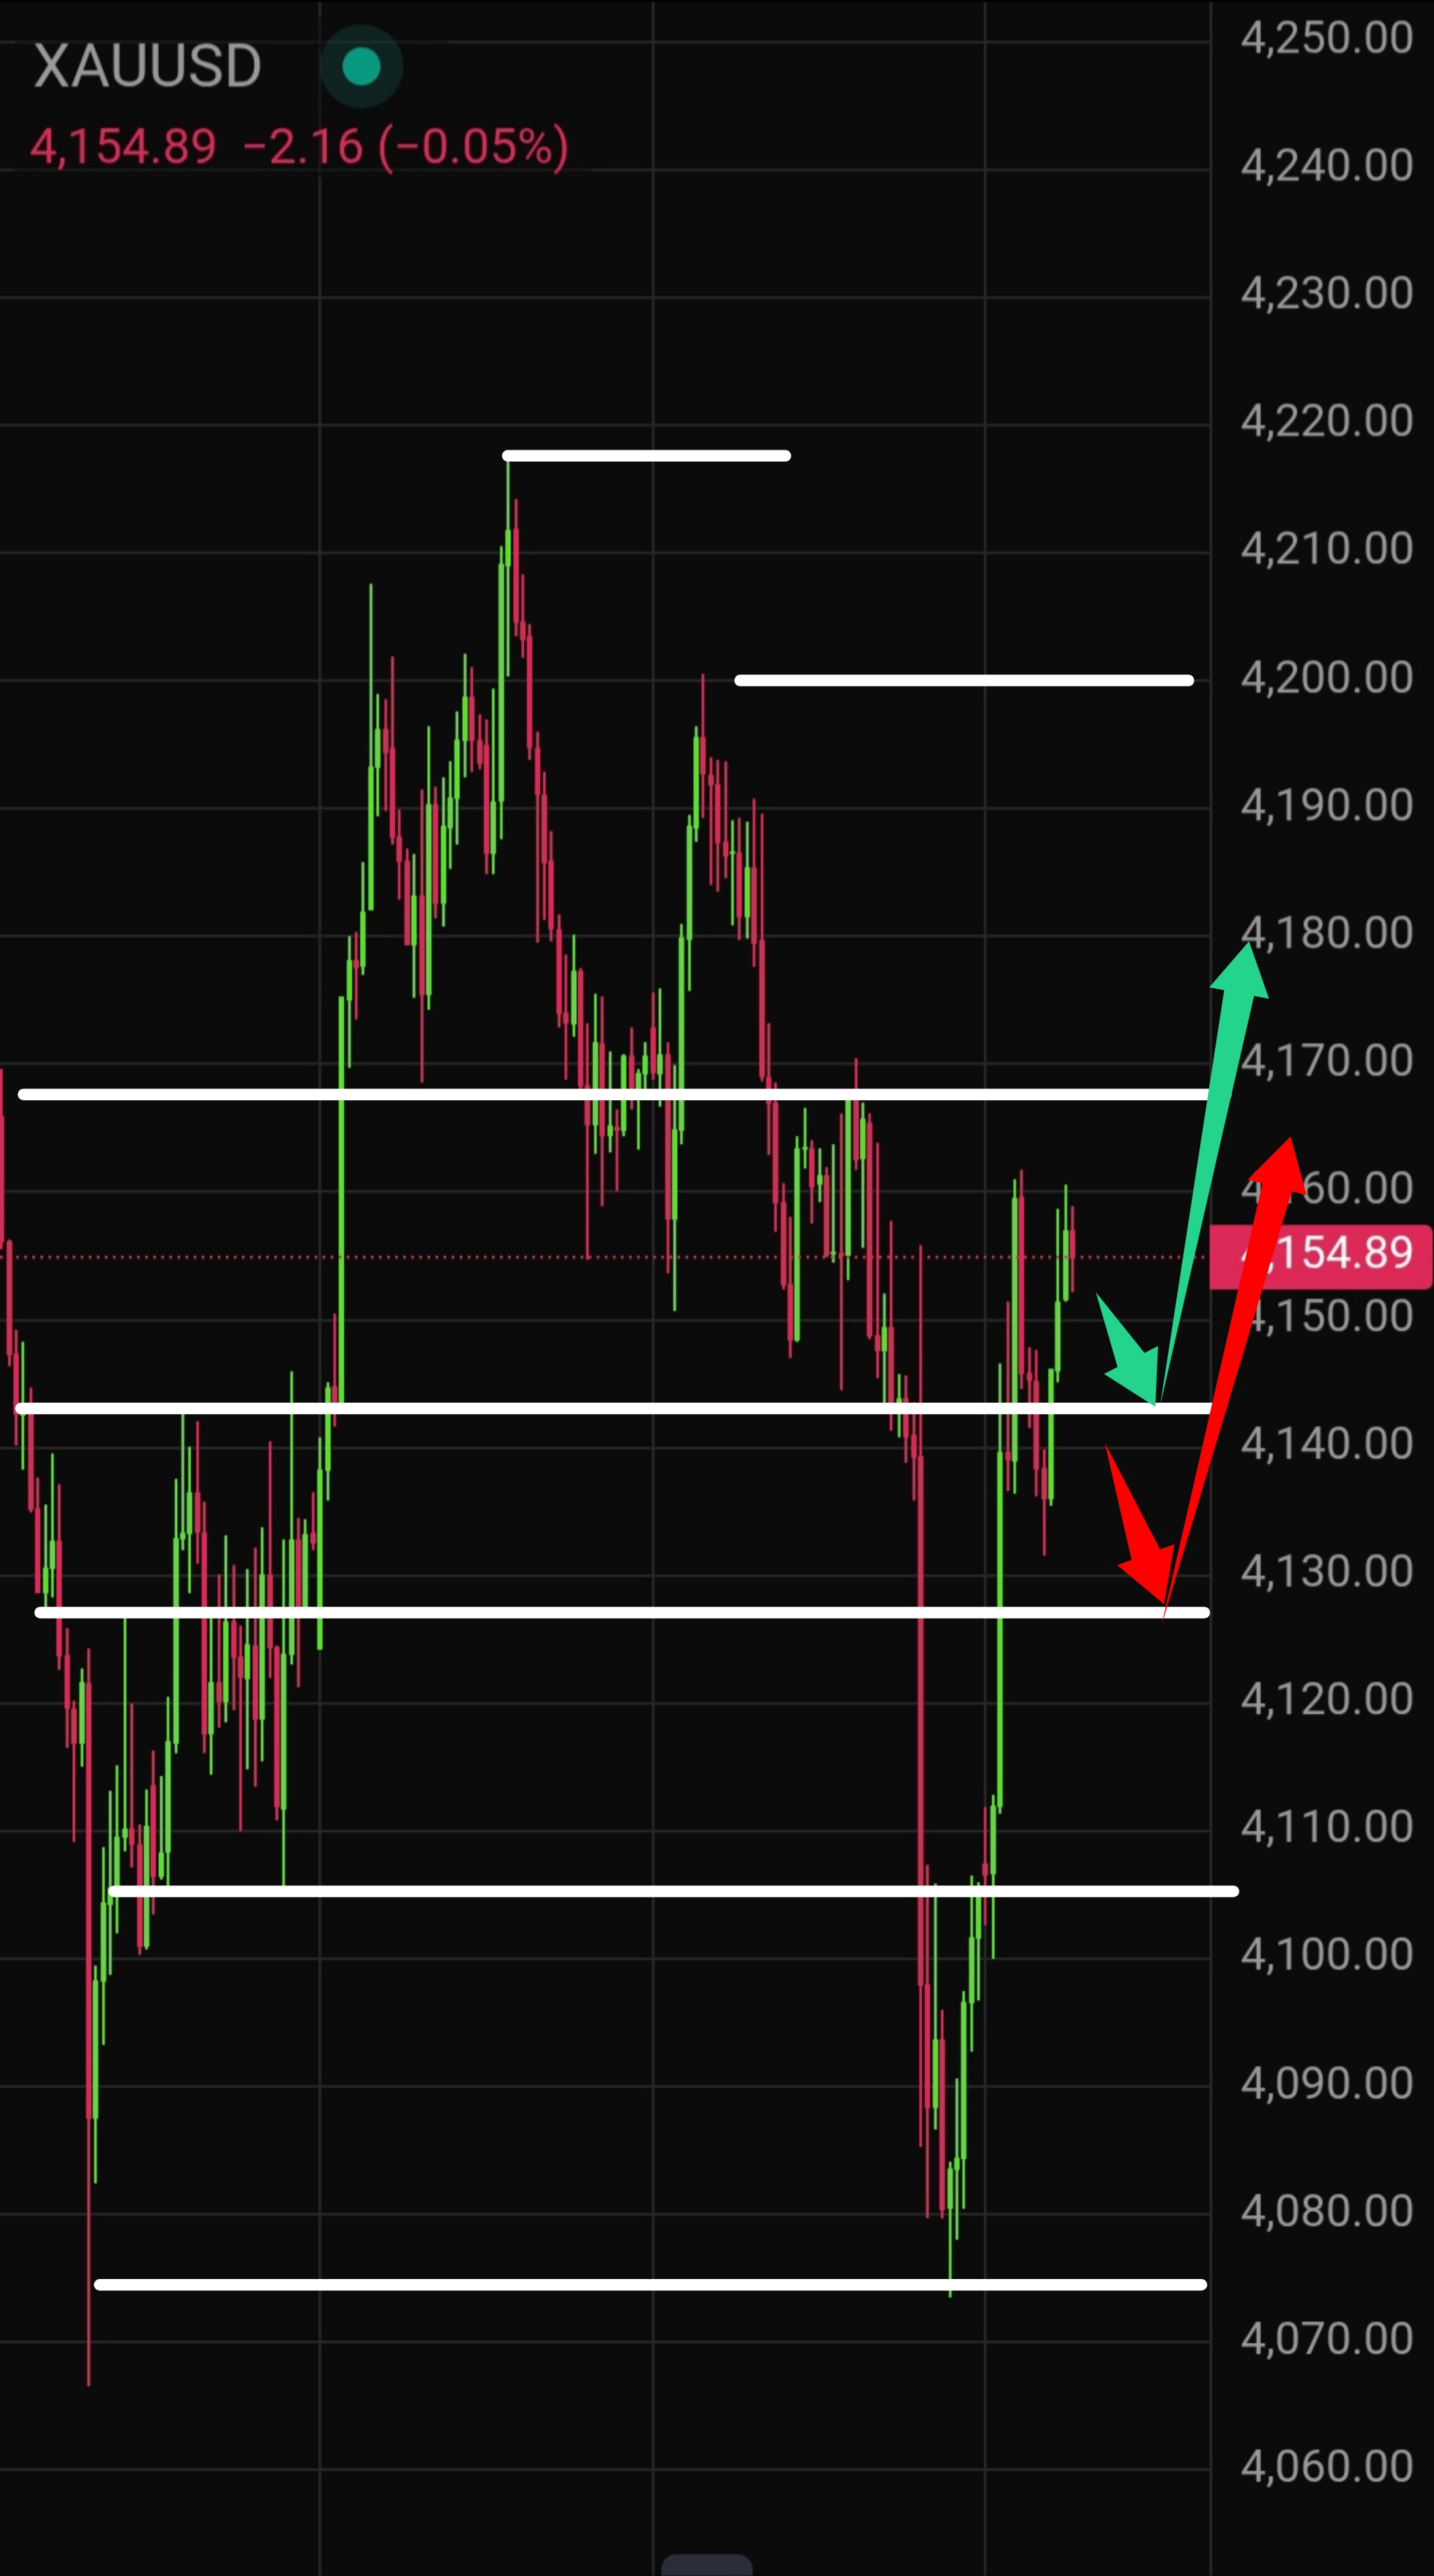
On the H4 chart price has entered the strong pivot area of $4,140–$4,160, which may prove difficult to clear in a single attempt. A high-quality demand zone sits at $4,140.
The gold technical analysis today therefore favours waiting for a retest of that level before looking for the next upside impulse.
Overall gold price technical outlook stays constructive above $4,140.
RSI: 52,23
MACD: Bullish
MA: 4,129
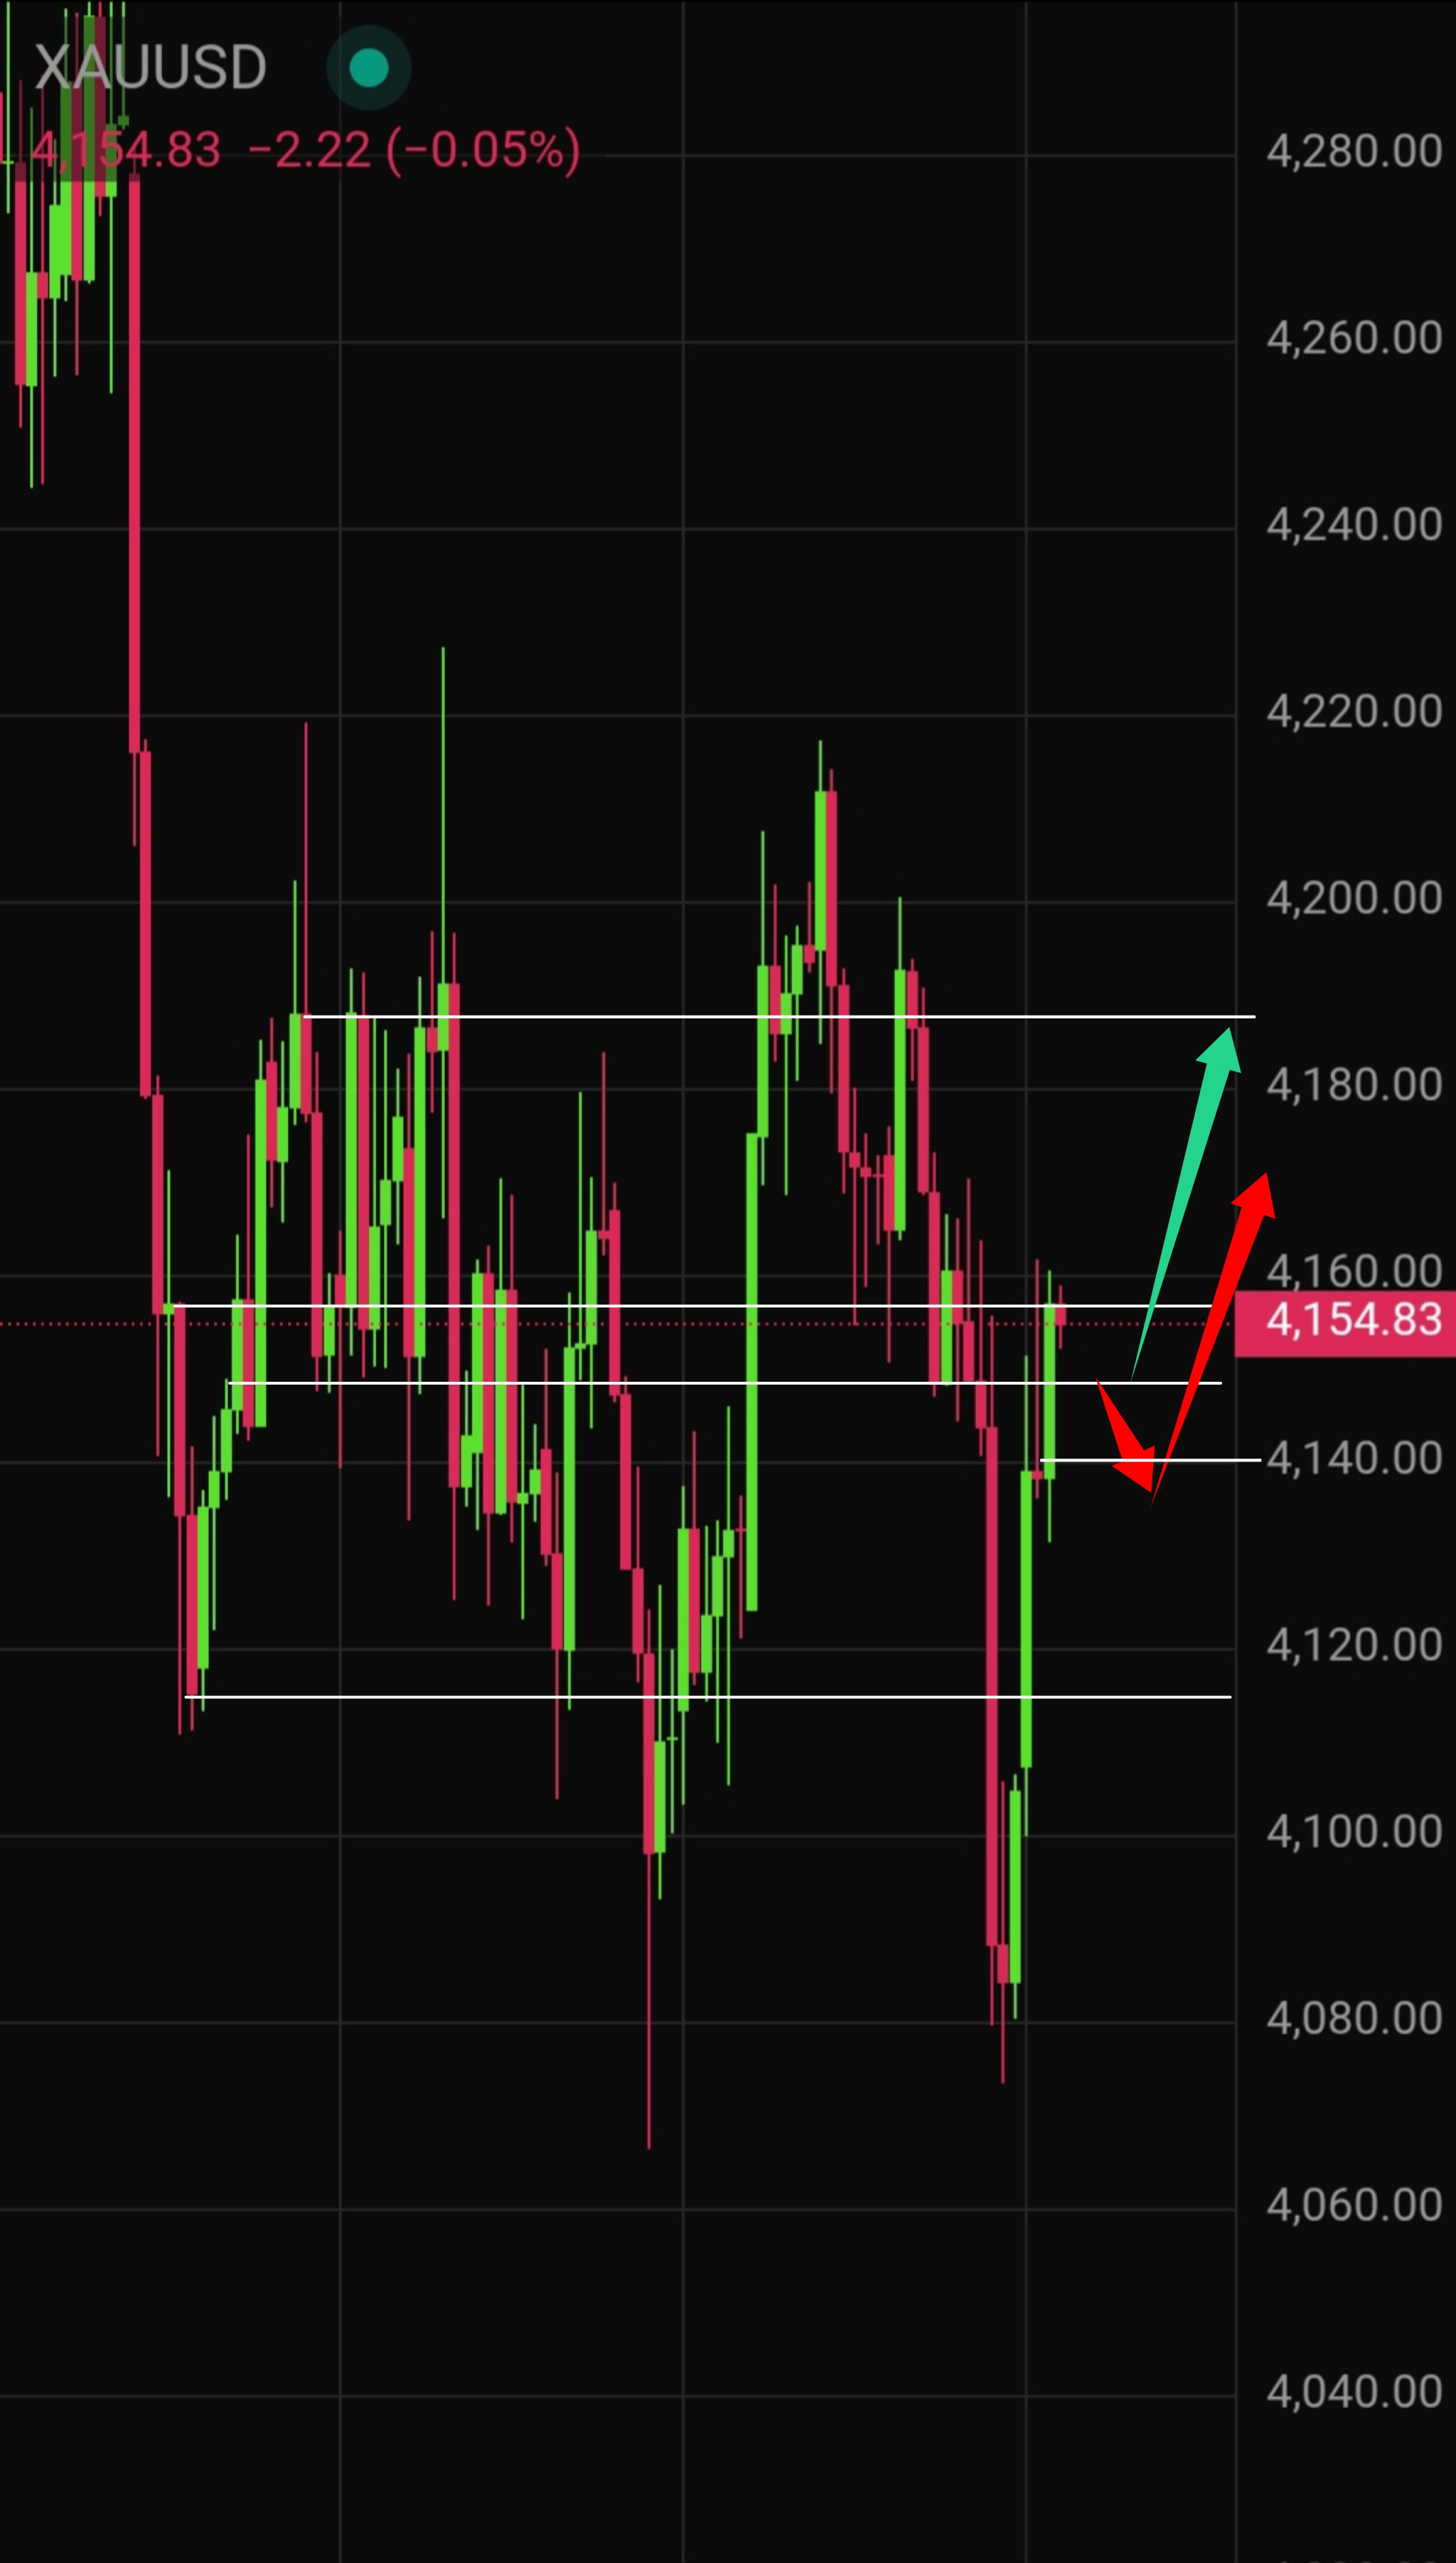
Key gold support and resistance levels:
- Support: $4,130, 4,140
- Resistance: $4,160, 4,170, 4,180
Gold (XAU/USD) Trading Plan for Today
Base scenario: decline to $4,140 then reversal higher toward $4,180.
Alternative scenario: advance toward $4,170–$4,180 from current levels.
Stops for long positions sit below $4,130.
This XAUUSD technical analysis latest keep the focus on the $4,140 demand zone as the key decision point.
Gold (XAU/USD) Live Price Today
XAUUSD live price remains under pressure after yesterday’s hotter-than-expected U.S. CPI, which lifted yields and the dollar. Markets now await today’s PPI, retail sales and jobless claims for fresh direction on the XAUUSD price now.

Yesterday, 14 October, U.S. inflation surprised to the upside. September CPI rose 0.6% month-on-month (vs 0.4% in August) and 3.7% year-on-year (vs 3.4% previously). Core CPI printed 0.3% m/m and 2.6% y/y. Gasoline prices jumped 9.1% on the month. The data reinforced expectations of a more restrictive Fed path, pushing Treasury yields and the dollar higher and weighing on gold.
Today, 15 October, the focus is on U.S. September PPI, retail sales and initial jobless claims — all released at 12:30 UTC (08:30 EDT). These figures will refine the inflation and growth picture that is currently pressuring the yellow metal.
Gold (XAU/USD) Price Forecast for Tomorrow
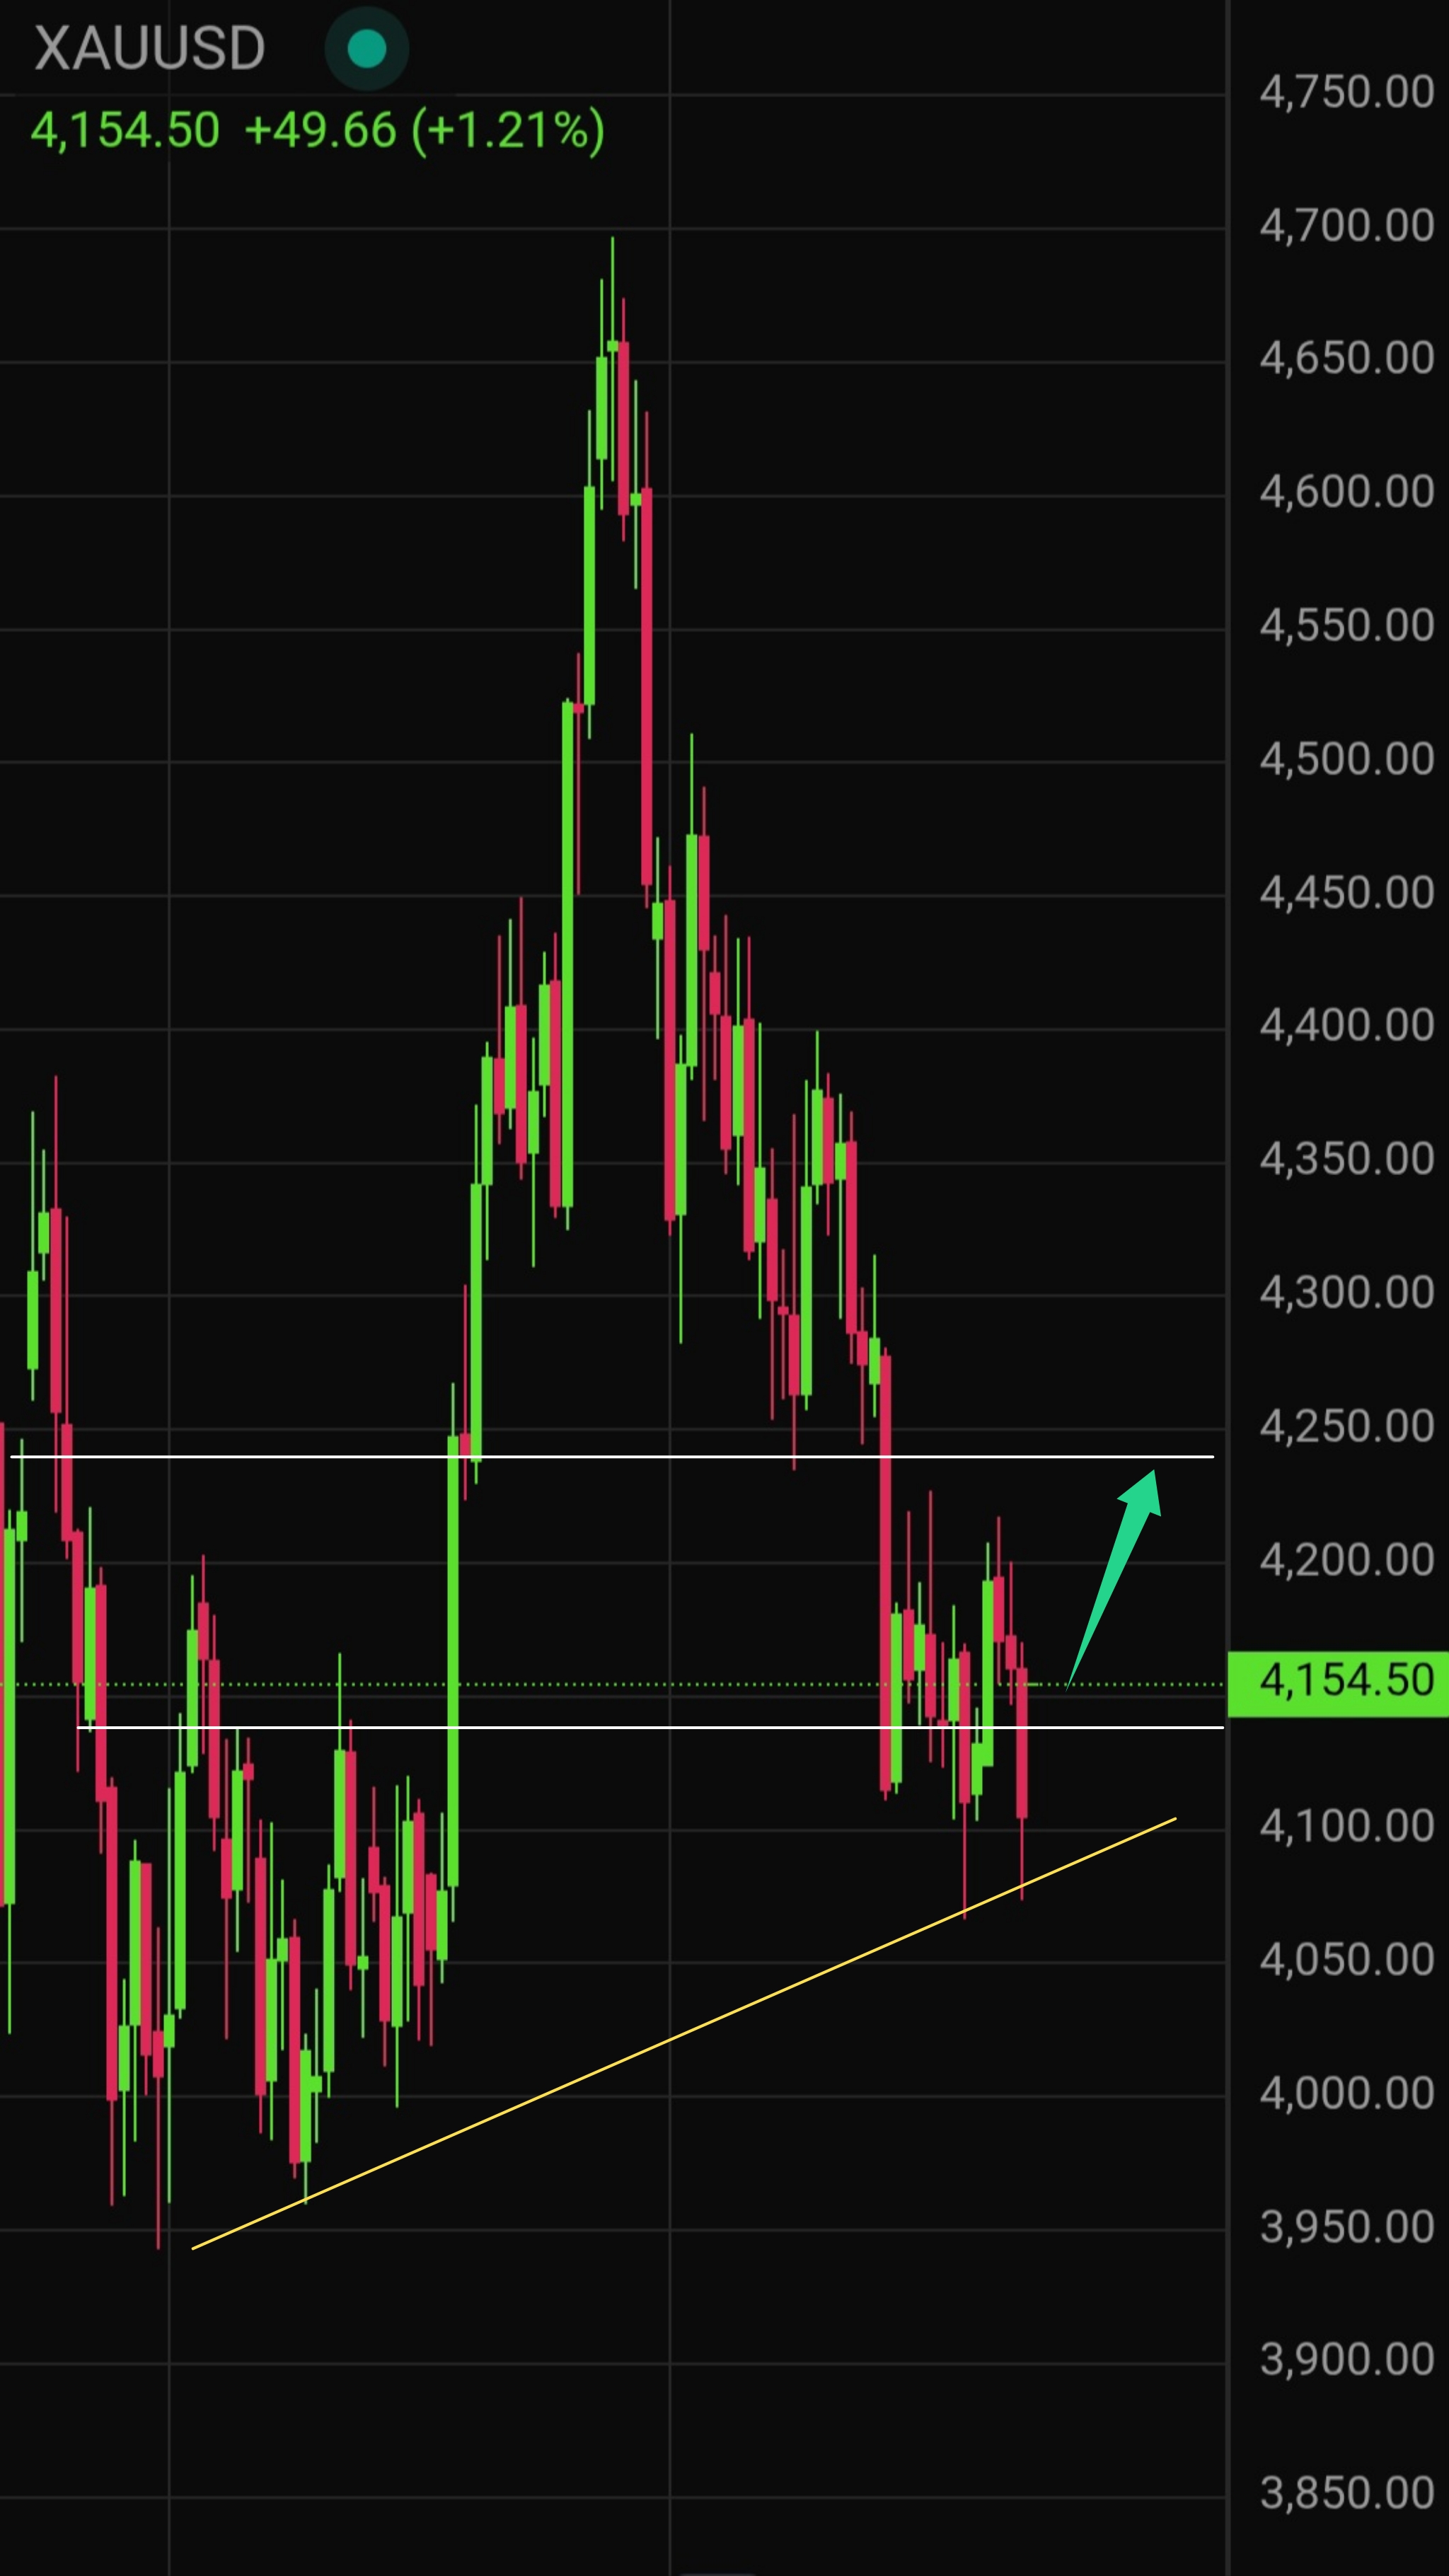
Tomorrow’s calendar features U.S. import and export price indexes for September, which will add colour to the inflation backdrop, especially given elevated energy costs. Industrial production and capacity utilisation follow at 18:15 UTC and may influence Fed-rate expectations.
| Date | October 15, 2026 |
| Minimum | $4,079 |
| Average | $4,120 |
| Maximum |
$4,161 |
Will gold go up tomorrow? Yes — the probability of a rebound is high, particularly if today’s data do not reinforce the dollar’s strength and price can hold the $4,140 zone.
Gold (XAU/USD) Price Forecast for This Week
The gold weekly outlook is dominated by U.S. inflation releases: CPI on 14 October at 13:30 UTC, followed by PPI and retail sales on 15 October at 13:30 UTC. Additional Fed speakers may appear on the calendar.
Strong inflation and consumer data tend to lift the dollar and yields, pressuring gold; weaker numbers can produce the opposite effect.
Gold price this week is likely to remain volatile inside a $4,100–$4,240 range.
| Date range | October 12–October 16, 2026 |
| Minimum | $4,073 |
| Average | $4,140 |
| Maximum | $4,218 |
Gold (XAU/USD) Price Forecast for the Next 30 Days
Major calendar items are:
- PPI and Retail Sales (15 Oct)
- Import/Export Price Indexes (16 Oct),
- the Fed meeting (27–28 Oct)
- Q3 GDP plus Personal Income/Outlays and PCE (29 Oct),
- Employment Cost Index (30 Oct).
Supply-side developments are also relevant: producing countries are increasingly retaining gold domestically. Laos is expanding its refining capacity, Indonesia has introduced export duties of up to 15%, China continues to restrict exports while its central bank buys, and several African nations are purchasing their own output. More gold is therefore being held outside international markets. At the same time central banks continue to diversify away from the dollar. Goldman Sachs maintains a $5,400 year-end 2027 target; higher rates may make the path uneven, yet the long-term view can still support dips.
The gold price outlook next month, XAU/USD 30 day forecast remain two-directional. Elevated energy-driven inflation and geopolitical uncertainty can support gold as a safe-haven asset. Conversely, a persistently hawkish Fed and firm CPI/PPI readings would lift yields and the dollar, capping upside.
The central sequence remains the recent CPI → today’s PPI/Retail Sales → the 28 October Fed decision.
| Date | Event | Potential impact |
| October 7 | FOMC Minutes | High |
|
October, 14 |
U.S. CPI | High |
| October 15 | PPI and Retail Sales | High |
| October 16 | Import/Export Price Indexes | High |
| October 27-28 | the Fed meeting | High |
30-Day Scenarios
Base case remains consolidation between $4,150 and $4,200.
A bullish scenario targets $4,240.
A bearish scenario would open a decline toward $4,100.
Gold Price Analysis and Forecasting Methodology
Our gold forecast methodology combines technical analysis, fundamental analysis and market sentiment. Technical analysis evaluates price action, trends, support and resistance, RSI, MACD and other indicators across multiple timeframes. Fundamental analysis considers interest rates, inflation, the US dollar, Treasury yields and major economic events. Sentiment analysis helps identify changes in investor positioning and risk appetite. The final forecast represents a scenario-based assessment of potential market movements and is not a guarantee of future prices.
Is Gold a Good Investment?
Is gold a good investment? Gold can play an important role in a diversified portfolio because it may provide diversification and help hedge against certain market and economic risks. Investors should consider their investment horizon, risk tolerance and current market conditions before making an investment decision.
You can start trading gold and other financial instruments with Investizo.
Summary
Gold is testing a key demand zone near $4,140 after yesterday’s inflation-driven sell-off. Near-term bias favours a rebound provided that support holds, while the broader 30-day picture stays range-bound between $4,100 and $4,240 pending clarity from U.S. data and the late-October Fed meeting.
Gold (XAU/USD) Price Forecast FAQs
What is the current price of XAU/USD now?
October 15, 2026
$
Will Gold Go Up Tomorrow?
Yes, the probability of a rebound is high. A retest of the $4,140 demand zone is possible first, but the structure favours continuation higher provided today’s U.S. data do not reinforce dollar strength.
Will Gold Rise or Fall Next Week?
The bias stays two-sided around the $4,140–$4,160 pivot. Strong U.S. data would keep pressure on gold, while softer figures or renewed safe-haven demand would open room toward $4,180–$4,200.
What Could Trigger a Short-Term Drop in Gold (XAU/USD)?
A decisive break below $4,140 would open the path toward $4,130 and potentially $4,100. Hotter PPI, strong retail sales or rising Treasury yields could quickly revive dollar strength and pressure the metal.
How Do We Do Gold Technical Analysis?
We analyze price action, trends, support and resistance levels, moving averages, RSI and MACD across H1, H4 and higher timeframes. Major events that can affect XAU/USD volatility are also considered.
How to Trade Gold Technical Analysis?
Technical analysis can help identify potential entry points, targets and stop-loss levels. A trading setup should be based on confirmation of the market scenario and predefined risk rather than a single indicator.
Nikolai Krishtopov is a Market Analyst at Investizo with more than 15 years of experience in the financial markets industry and over a decade of trading experience. His areas of focus include forex and crypto markets, technical analysis, intraday trading and market behaviour.
Award history
More about awards
2023—2025 - 8 awards archived